Power BI
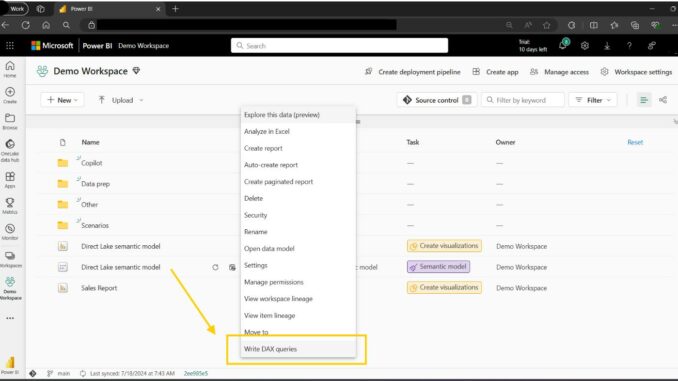
Create Visualization With Dynamic Axis Using Field Parameters
Sections Introduction Often times we may need to create multiple charts for the same metric to show the breakdown by different fields. For example, 3 different bar charts for Quantity Sold broken by 3 different […]