

From the Desk of Ian Culley @IanCulley
It’s beginning to feel an awful lot like 2022.
Rates and the dollar are on pause, bonds can’t stop falling, and the major equity indexes are violating critical support levels.
But the 2s10s spread raised serious questions this week as it hit fresh 52-week highs.
So, is the market environment changing?
Let’s find out…
Check out the 2s10s spread challenging zero from below:
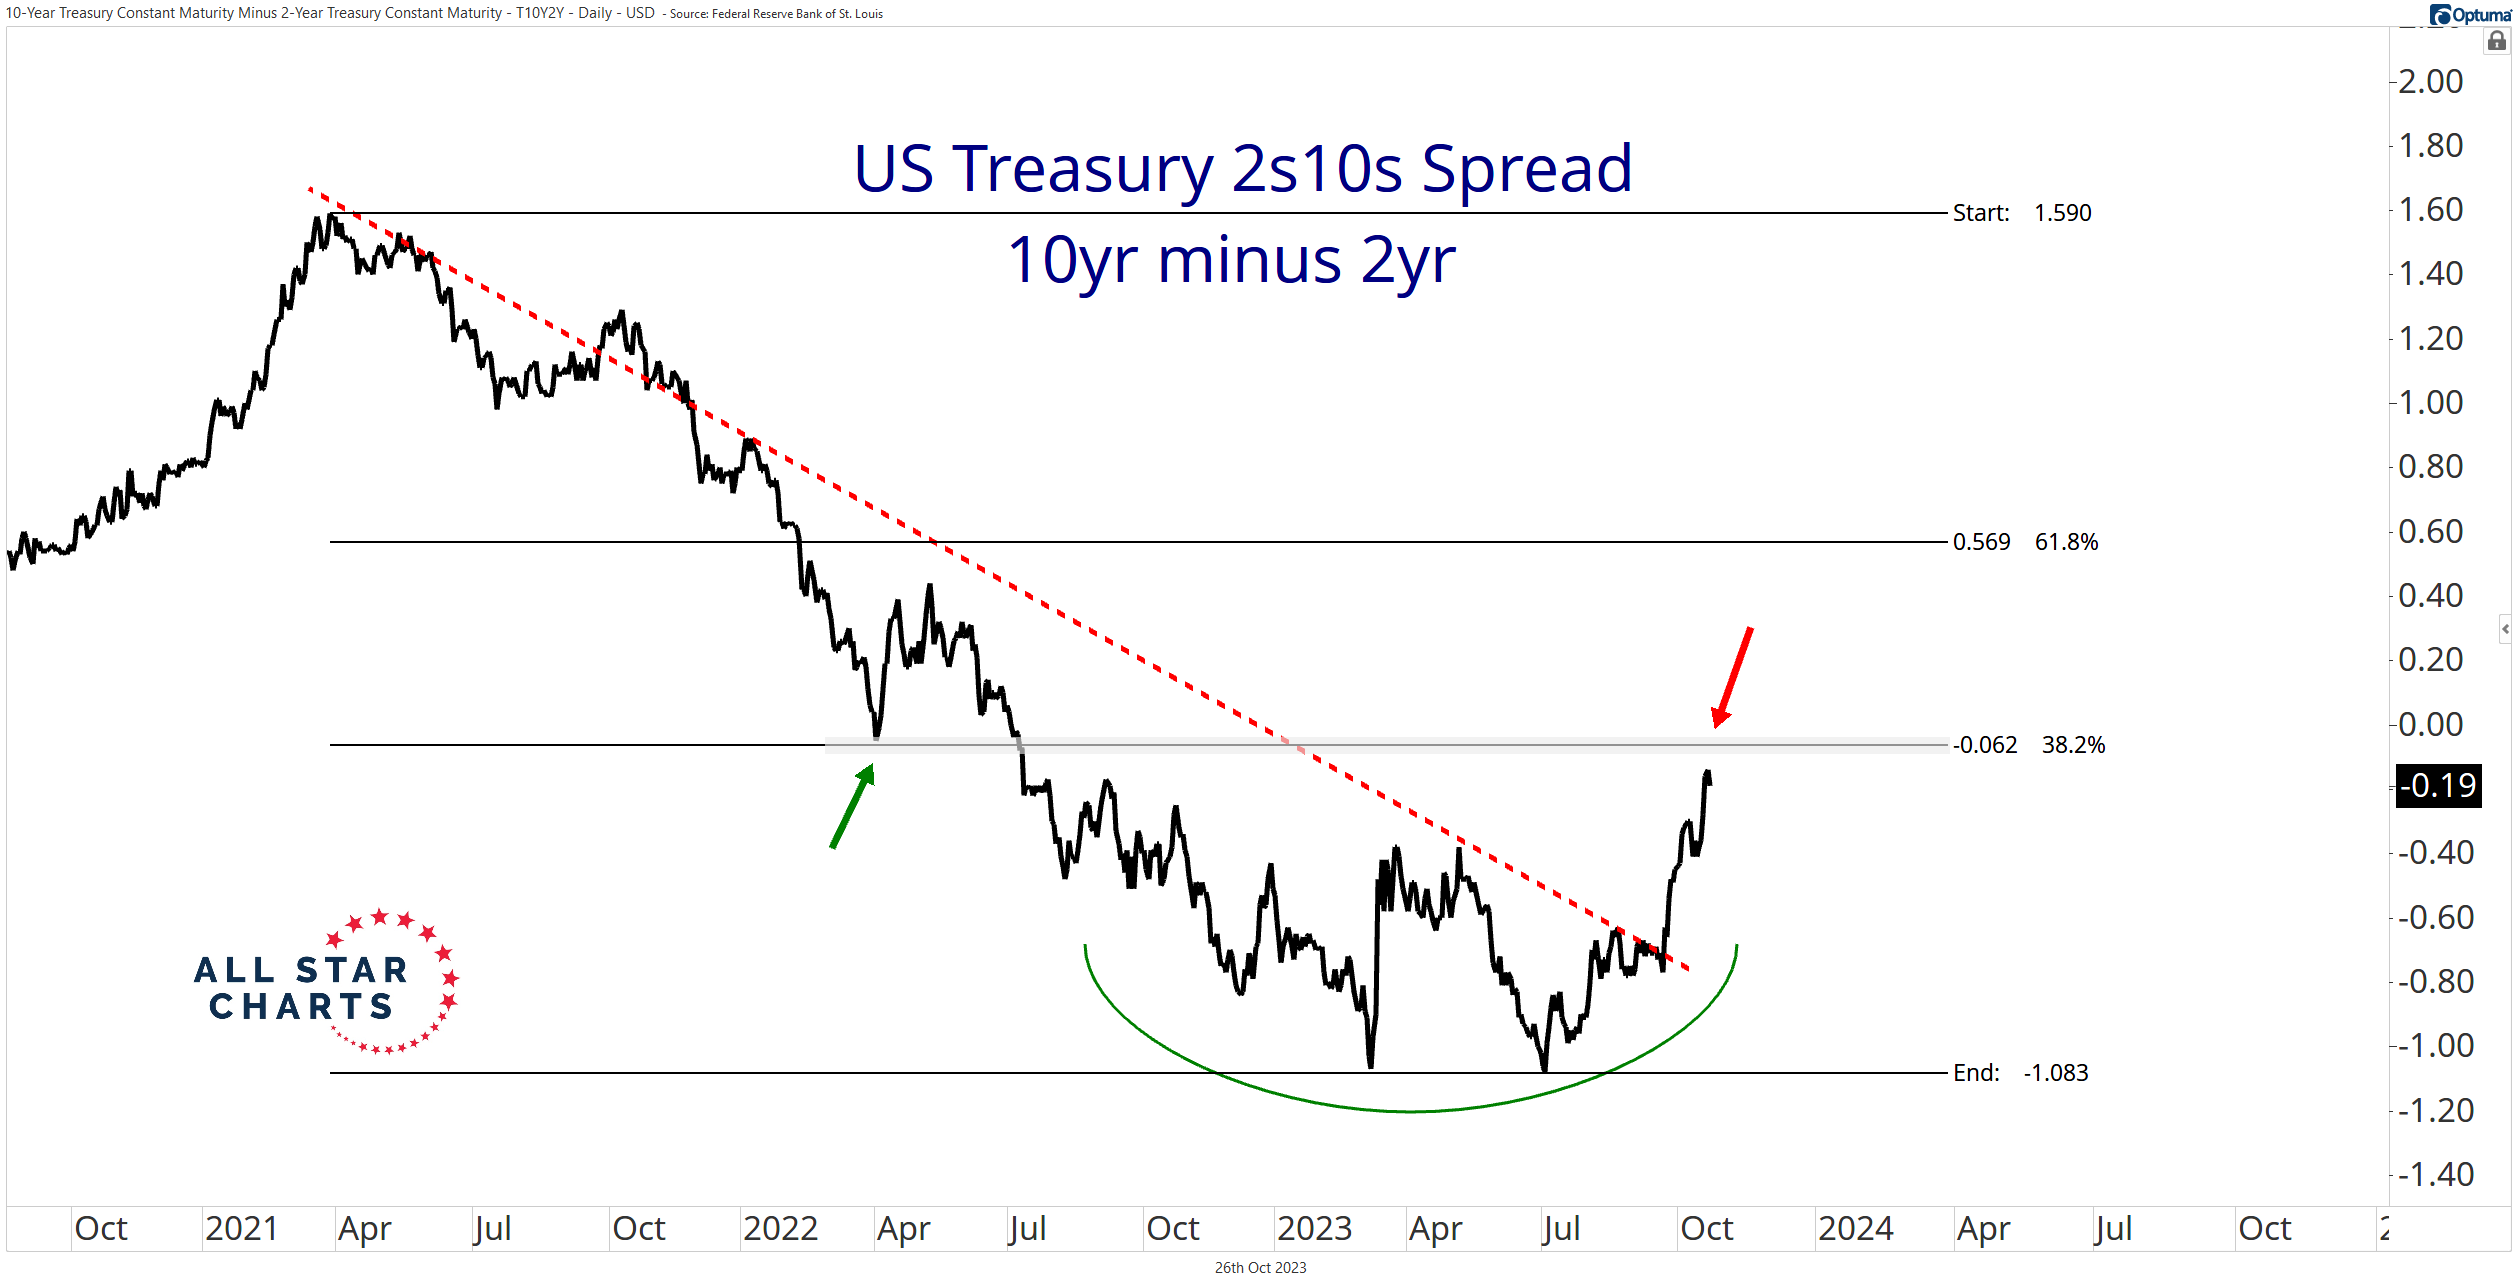
An inverted yield curve (widely measured by the 2s10s and 3mo.-10yr. spreads) has cast a pall over capital markets, promising an economic recession for over a year. Yet the US economy remains strong.
The curve is now flattening to levels not witnessed since the summer of 2022.
Perhaps it will continue to steepen in the coming months. On the other hand, this could be nothing more than a standard pullback.
Incidentally, the zero line on the 2s10s chart coincides with a critical retracement level supporting the latter.
Fibonacci retracement levels, though incredibly useful, aren’t the end-all-be-all analytical tool. However, critical intermarket ratios are aligning with last year’s patterns…
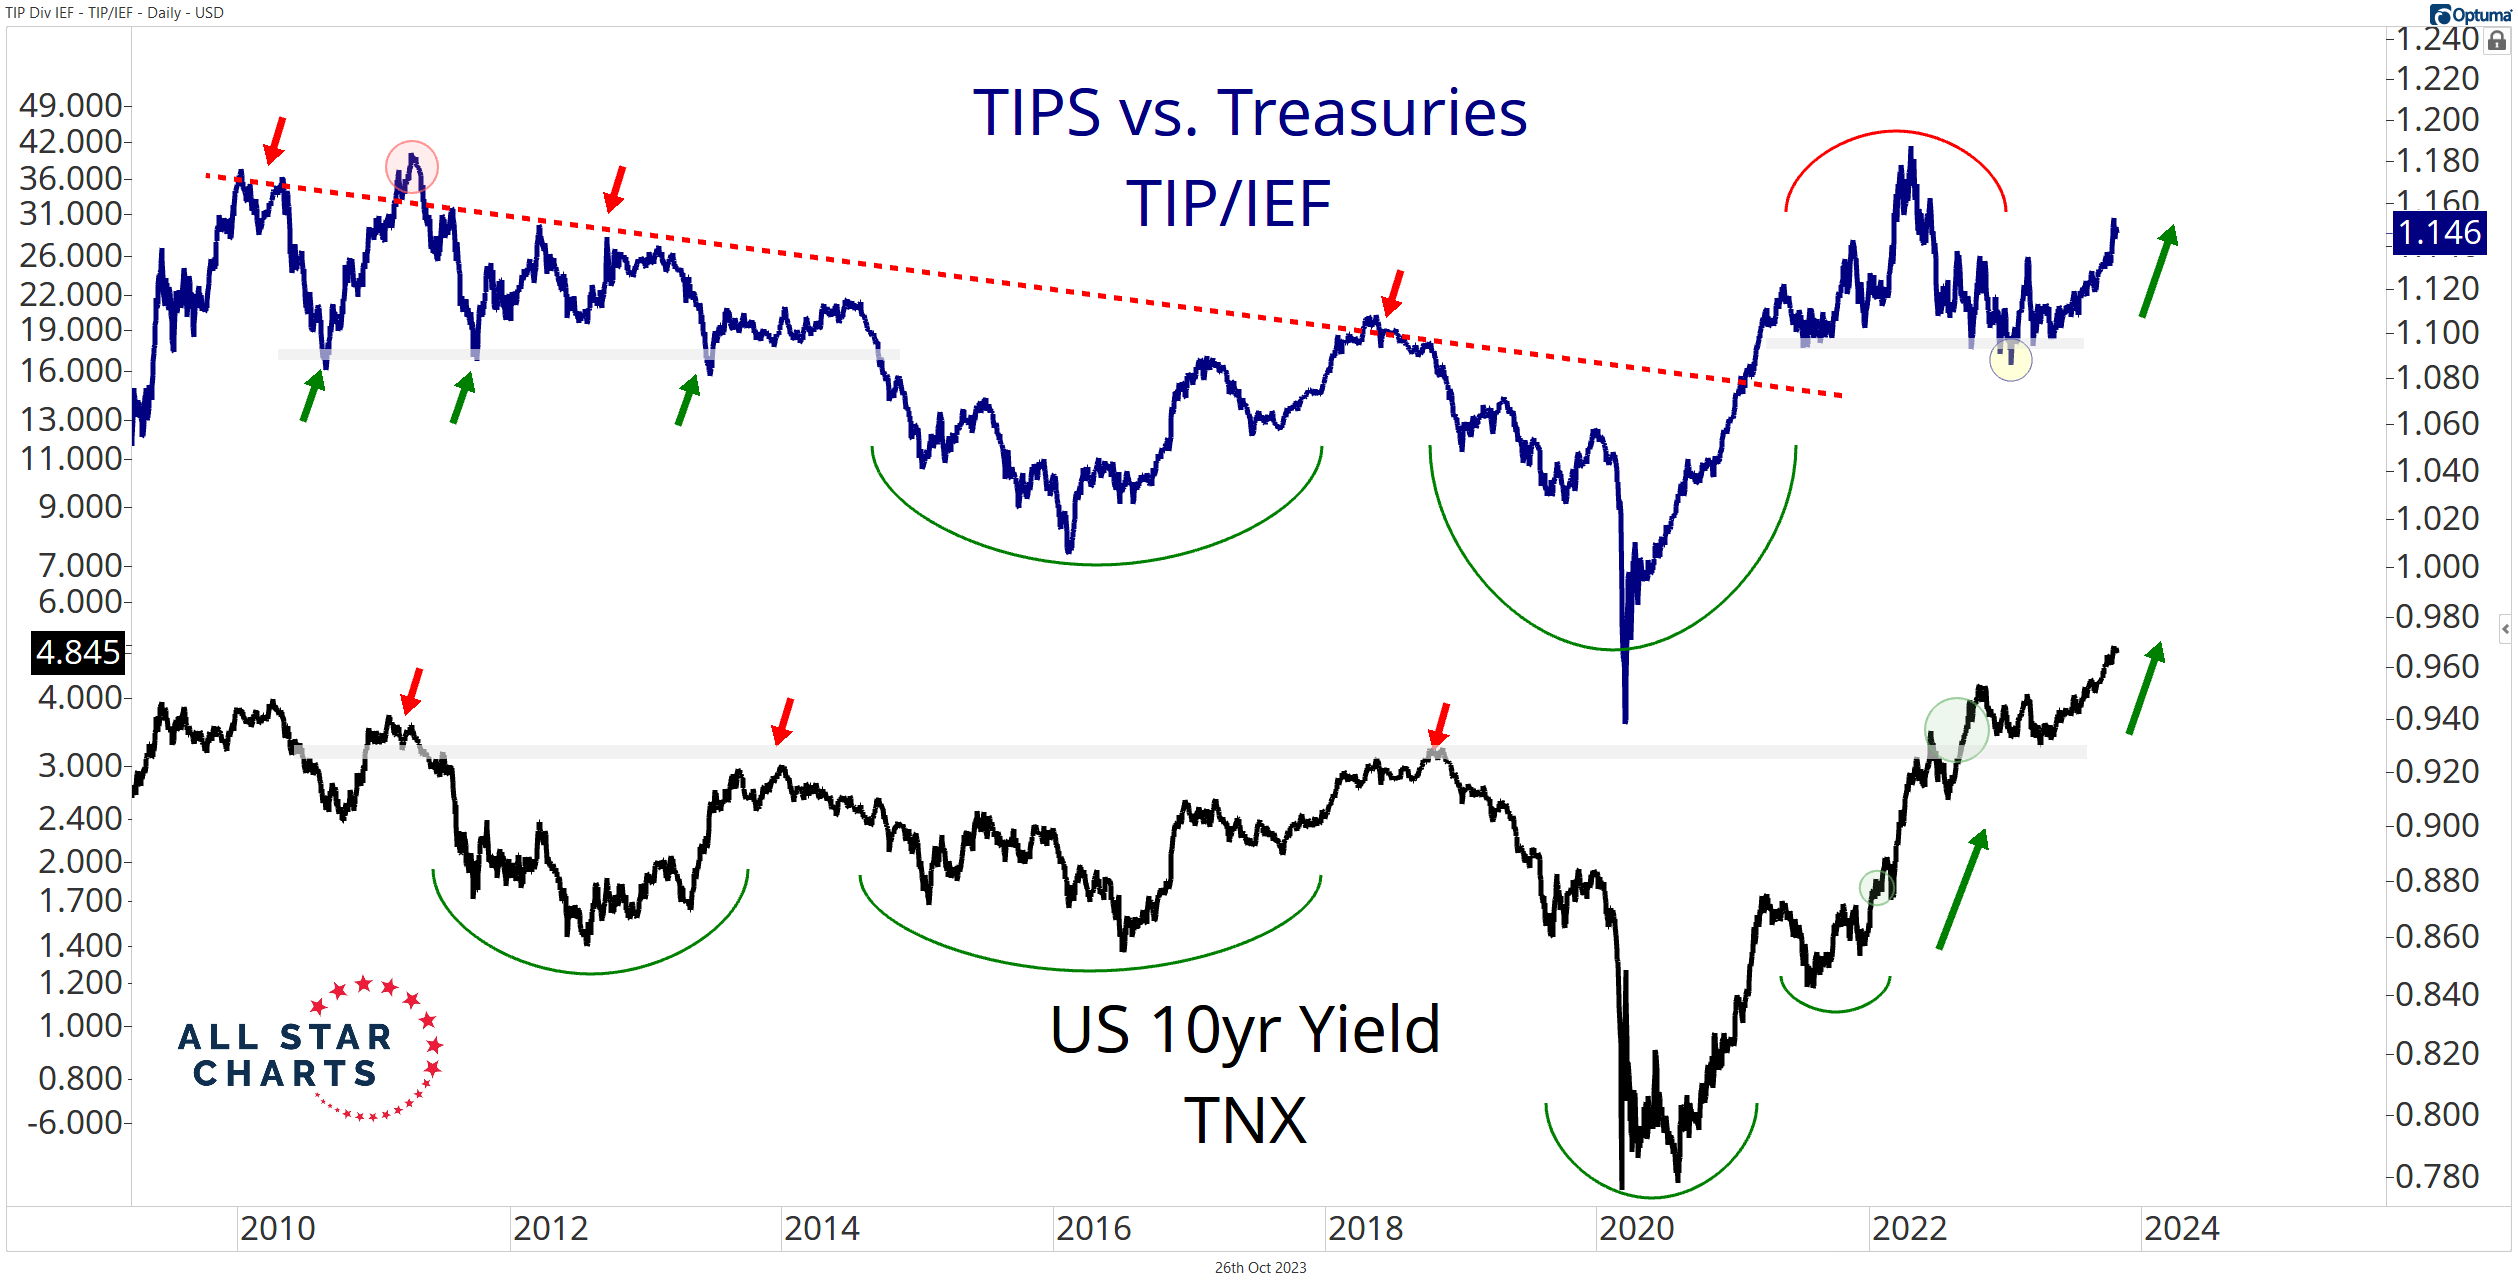
Inflation expectations measured by the TIPS ETF $TIP vs. the US T-note ETF $IEF are rising, much like the months heading into the Fed’s first rate hike last year.
Interestingly, breakevens (another measure of inflation expectations) have yet to produce a similar rally.
We can attribute this disparity to the denominator – bonds.
Now would be an opportune time for a Bloomberg Magazine cover titled “Bonds: Can’t Stop, Won’t Stop… Falling.” (I can see the cover now.)
Regardless of the reason, the positive correlation between the 10-year yield and the TIPS/IEF ratio remains intact, suggesting more of the same in terms of market environment.
It’s the same story for credit spreads…
Here’s the High Yield Bond ETF $HYG vs. the US T-note ETF $IEI, one of our preferred ways of tracking credit spreads and bond market stability:
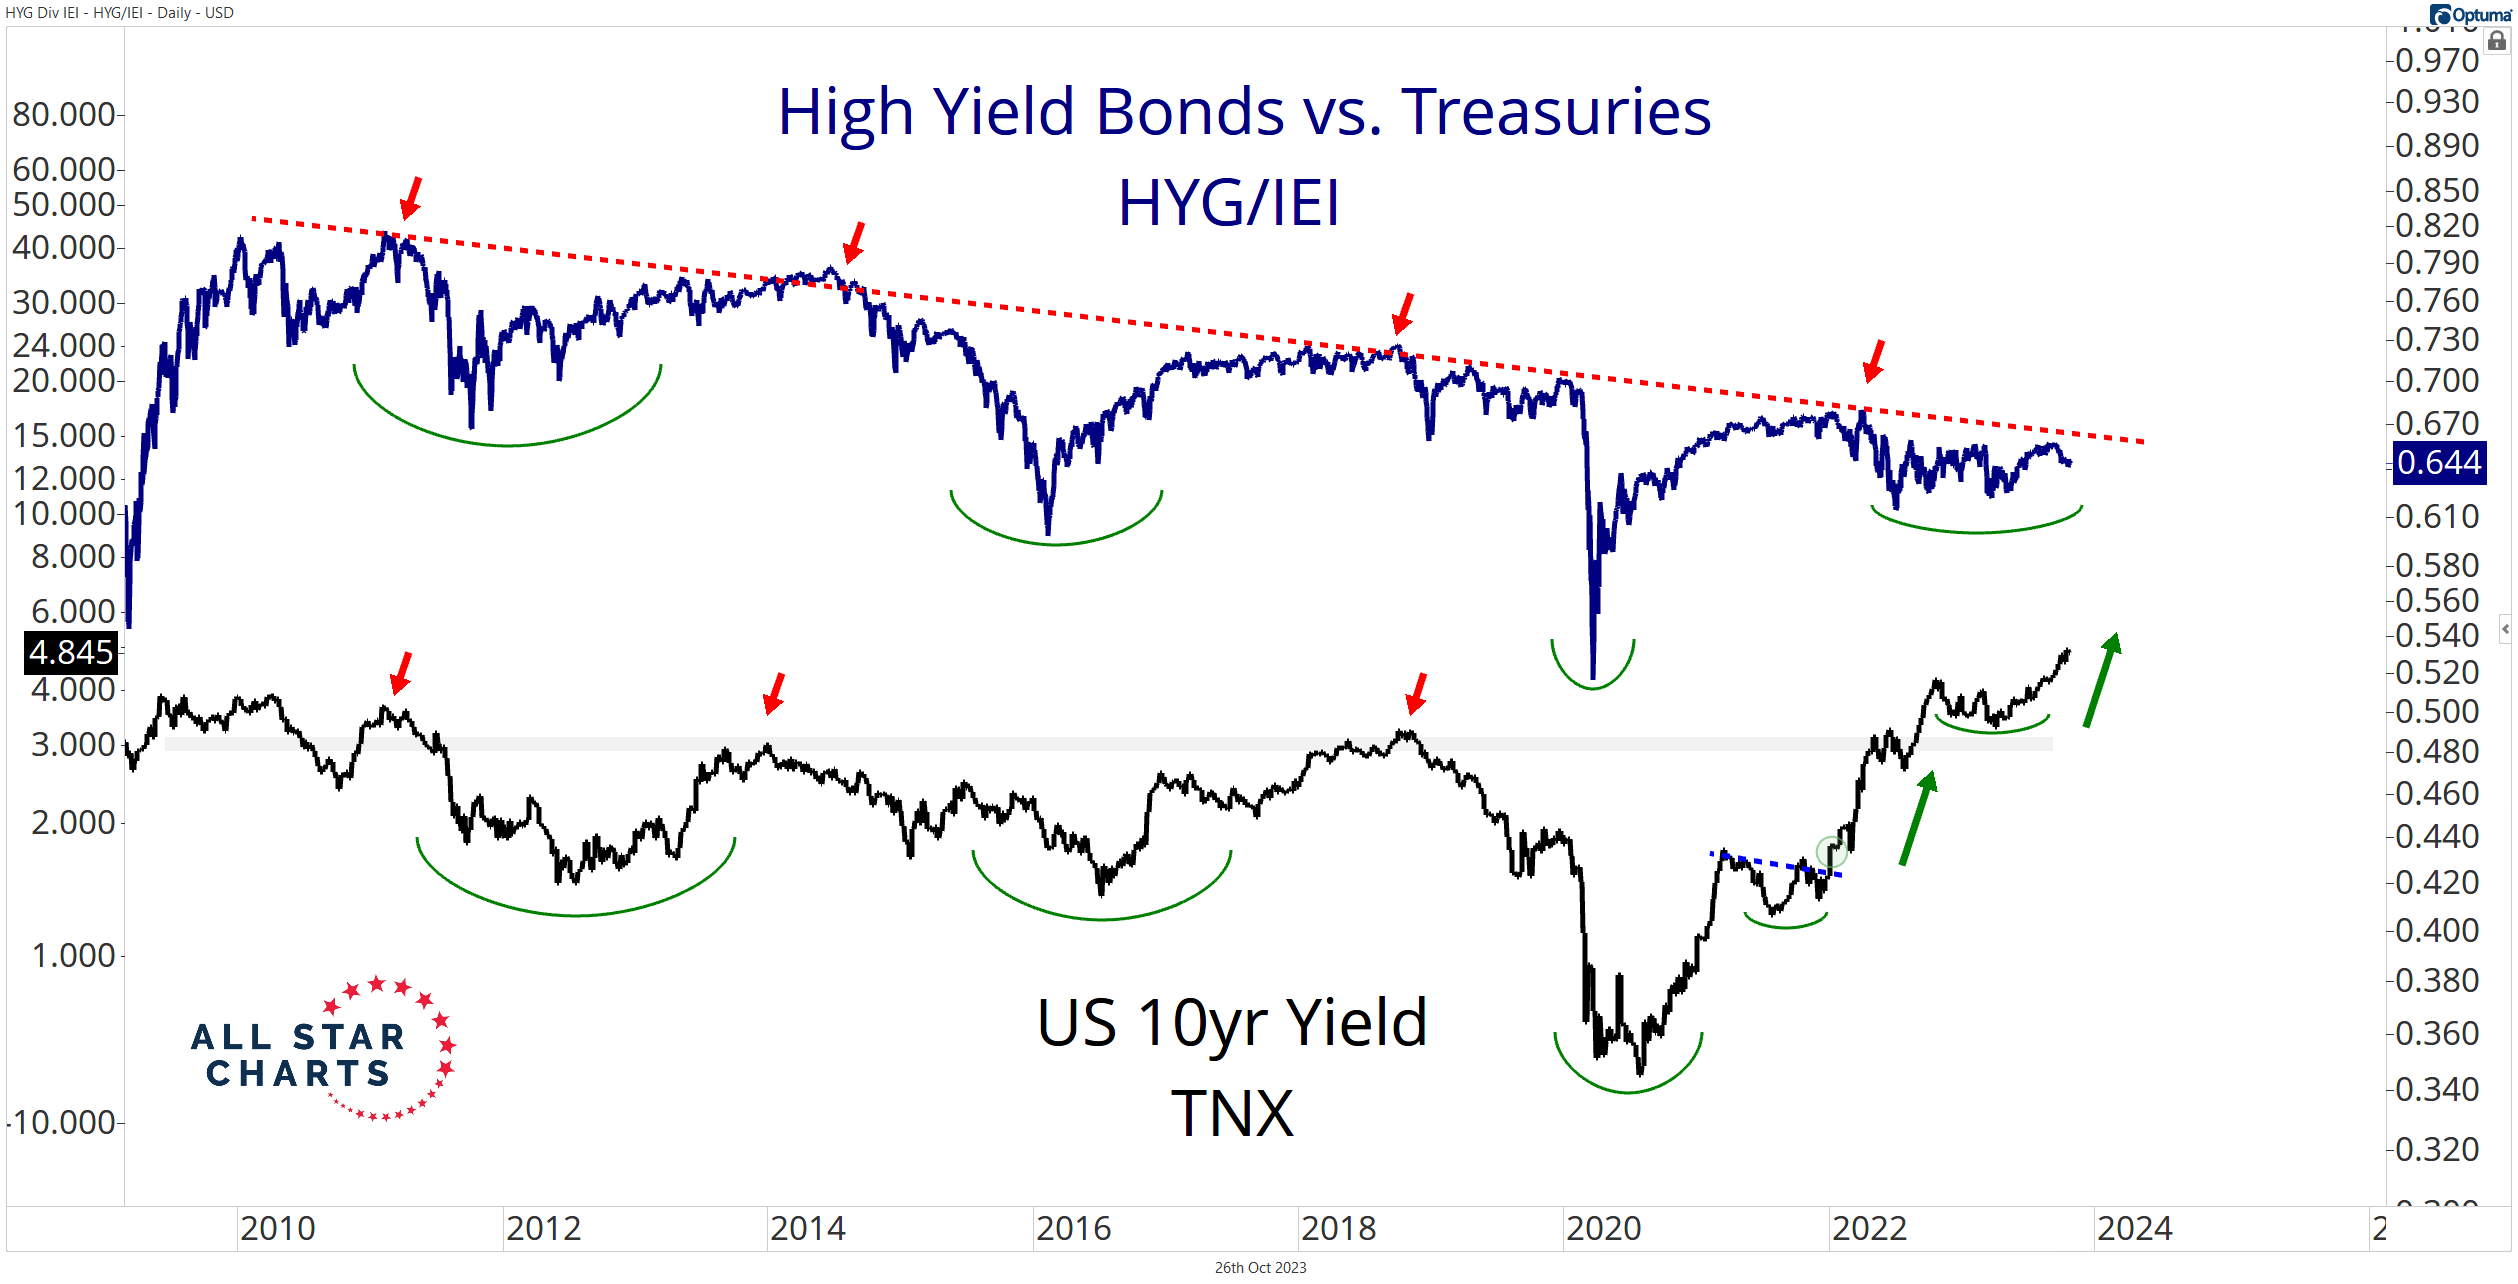
Like last year, HYG/IEI is chopping sideways to lower. No alarms blare across the bond market – just an orderly, historic sell-off in US treasuries. Remain calm and carry on.
The Russell 2000 $IWM vs. the S&P 500 $SPY is another ratio tracking last year’s trend.
IWM/SPY experienced a sharp decline as the 10-year rose during the first half of 2022.
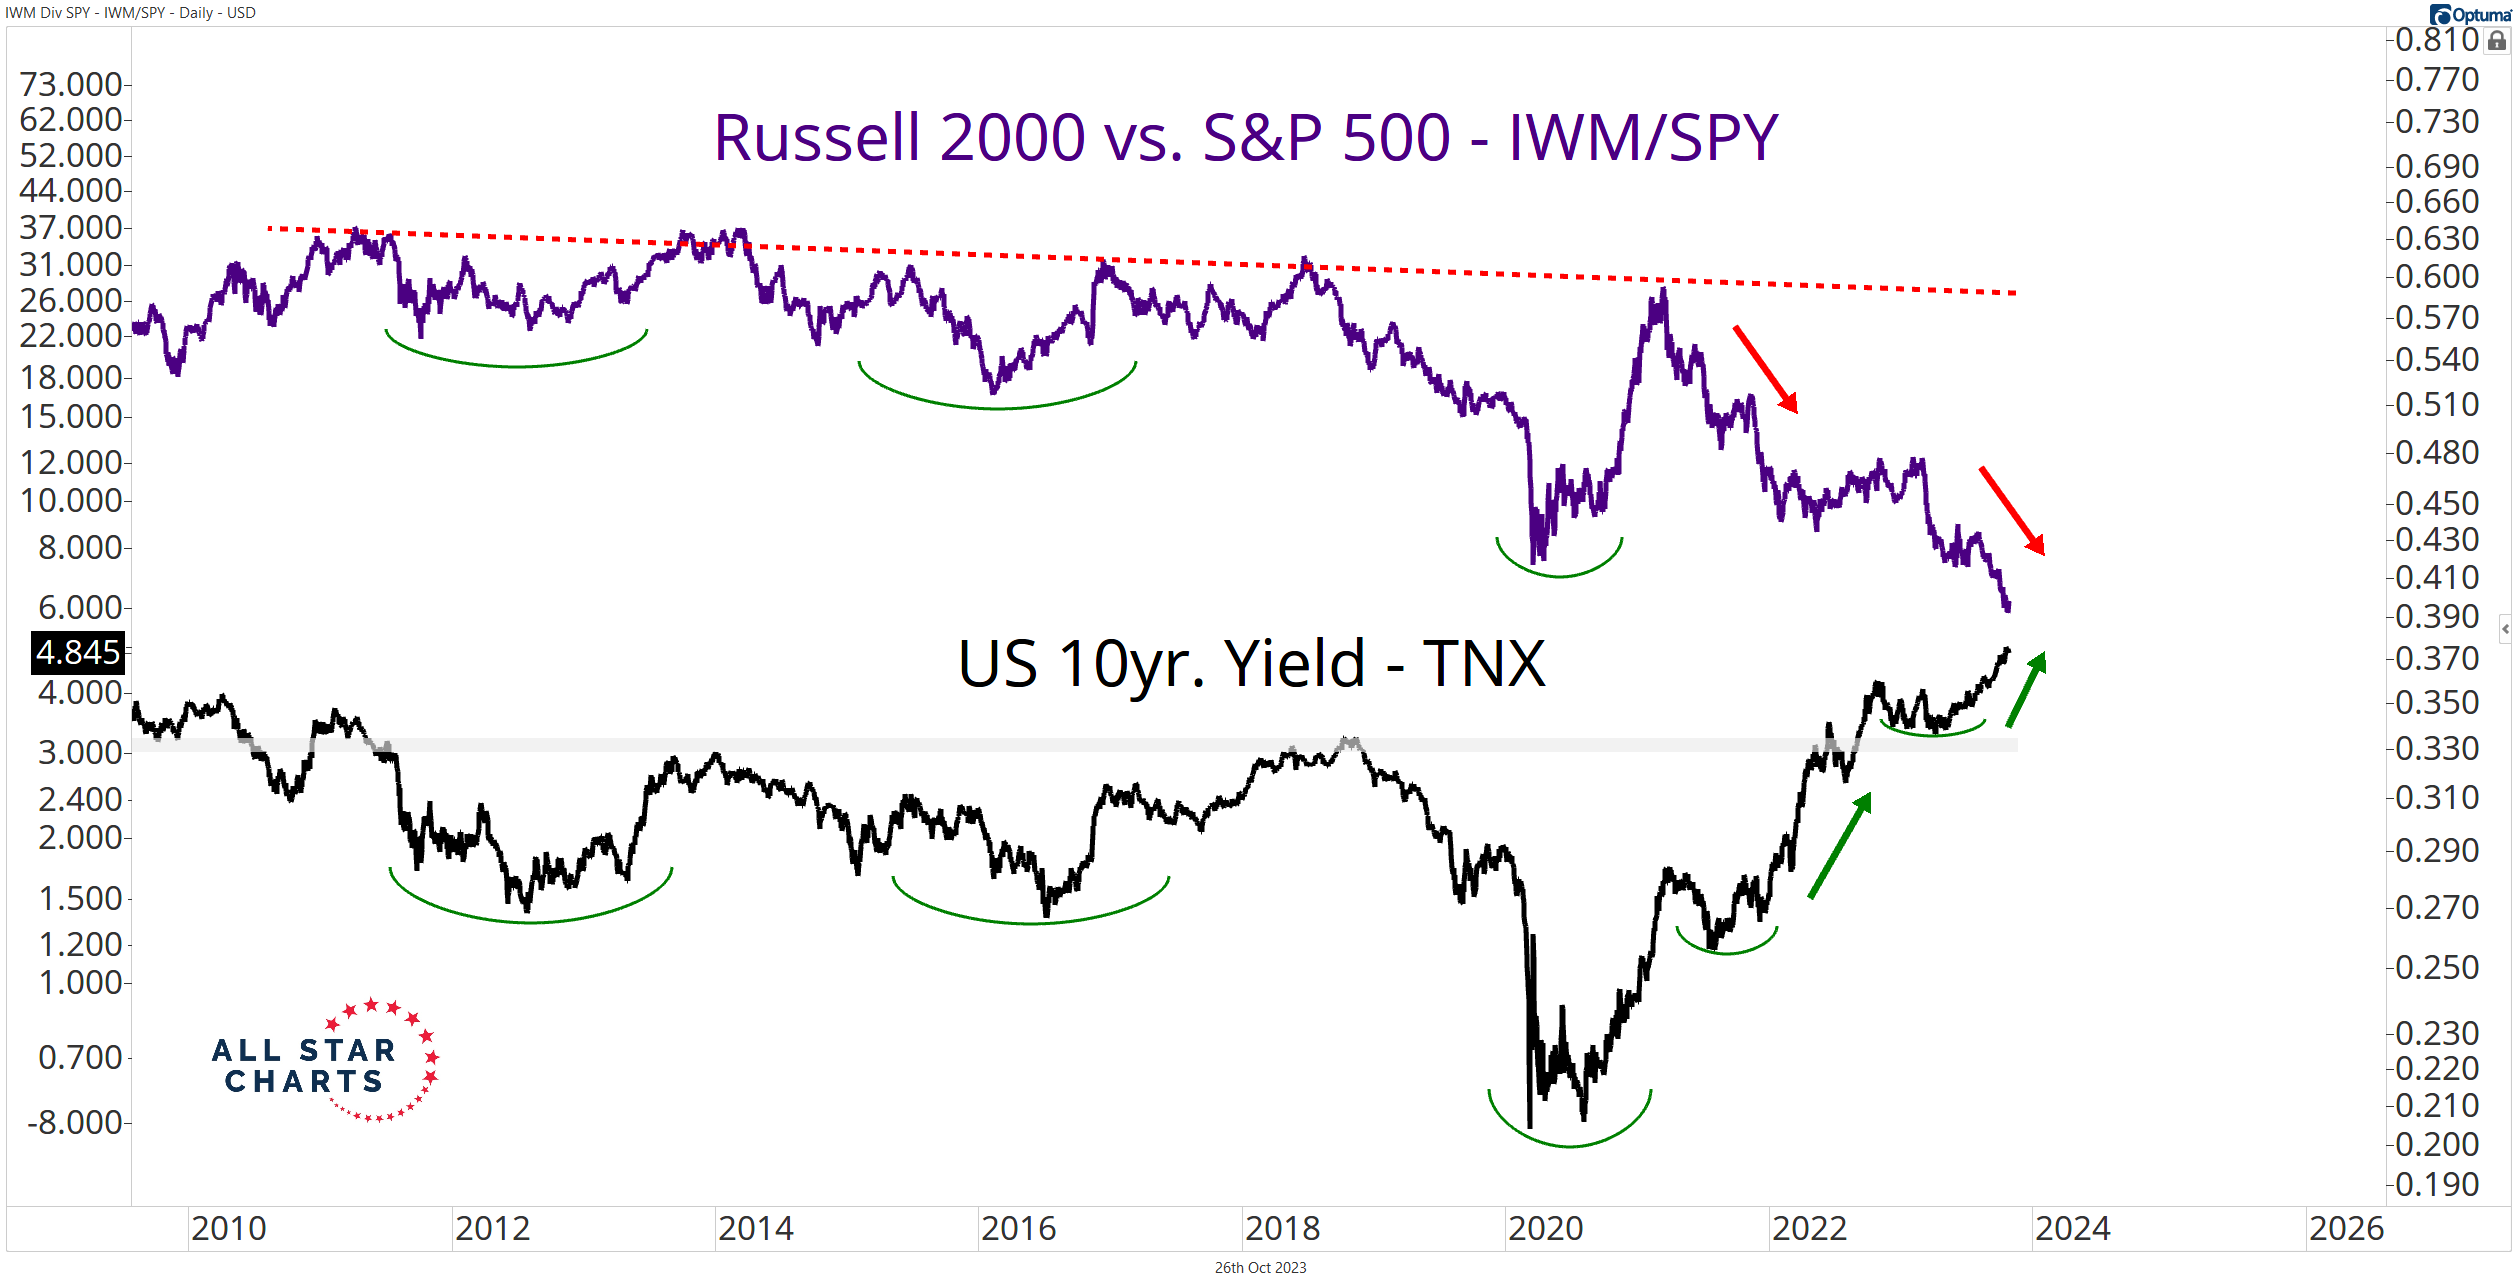
The Russell is printing fresh relative lows as the 10-year tests the 5% level. Nothing new here.
Rising rates tend to benefit the cyclical value-oriented Russell 2000 index. But that hasn’t been the case since March 2021.
The continued deterioration of this once-positive correlation is another data point leading the market down a familiar path cleared by last year’s selloff.
Not all intermarket ratios or relationships are following along, though.
Small-cap value has yet to take over small-cap growth stocks on relative terms:
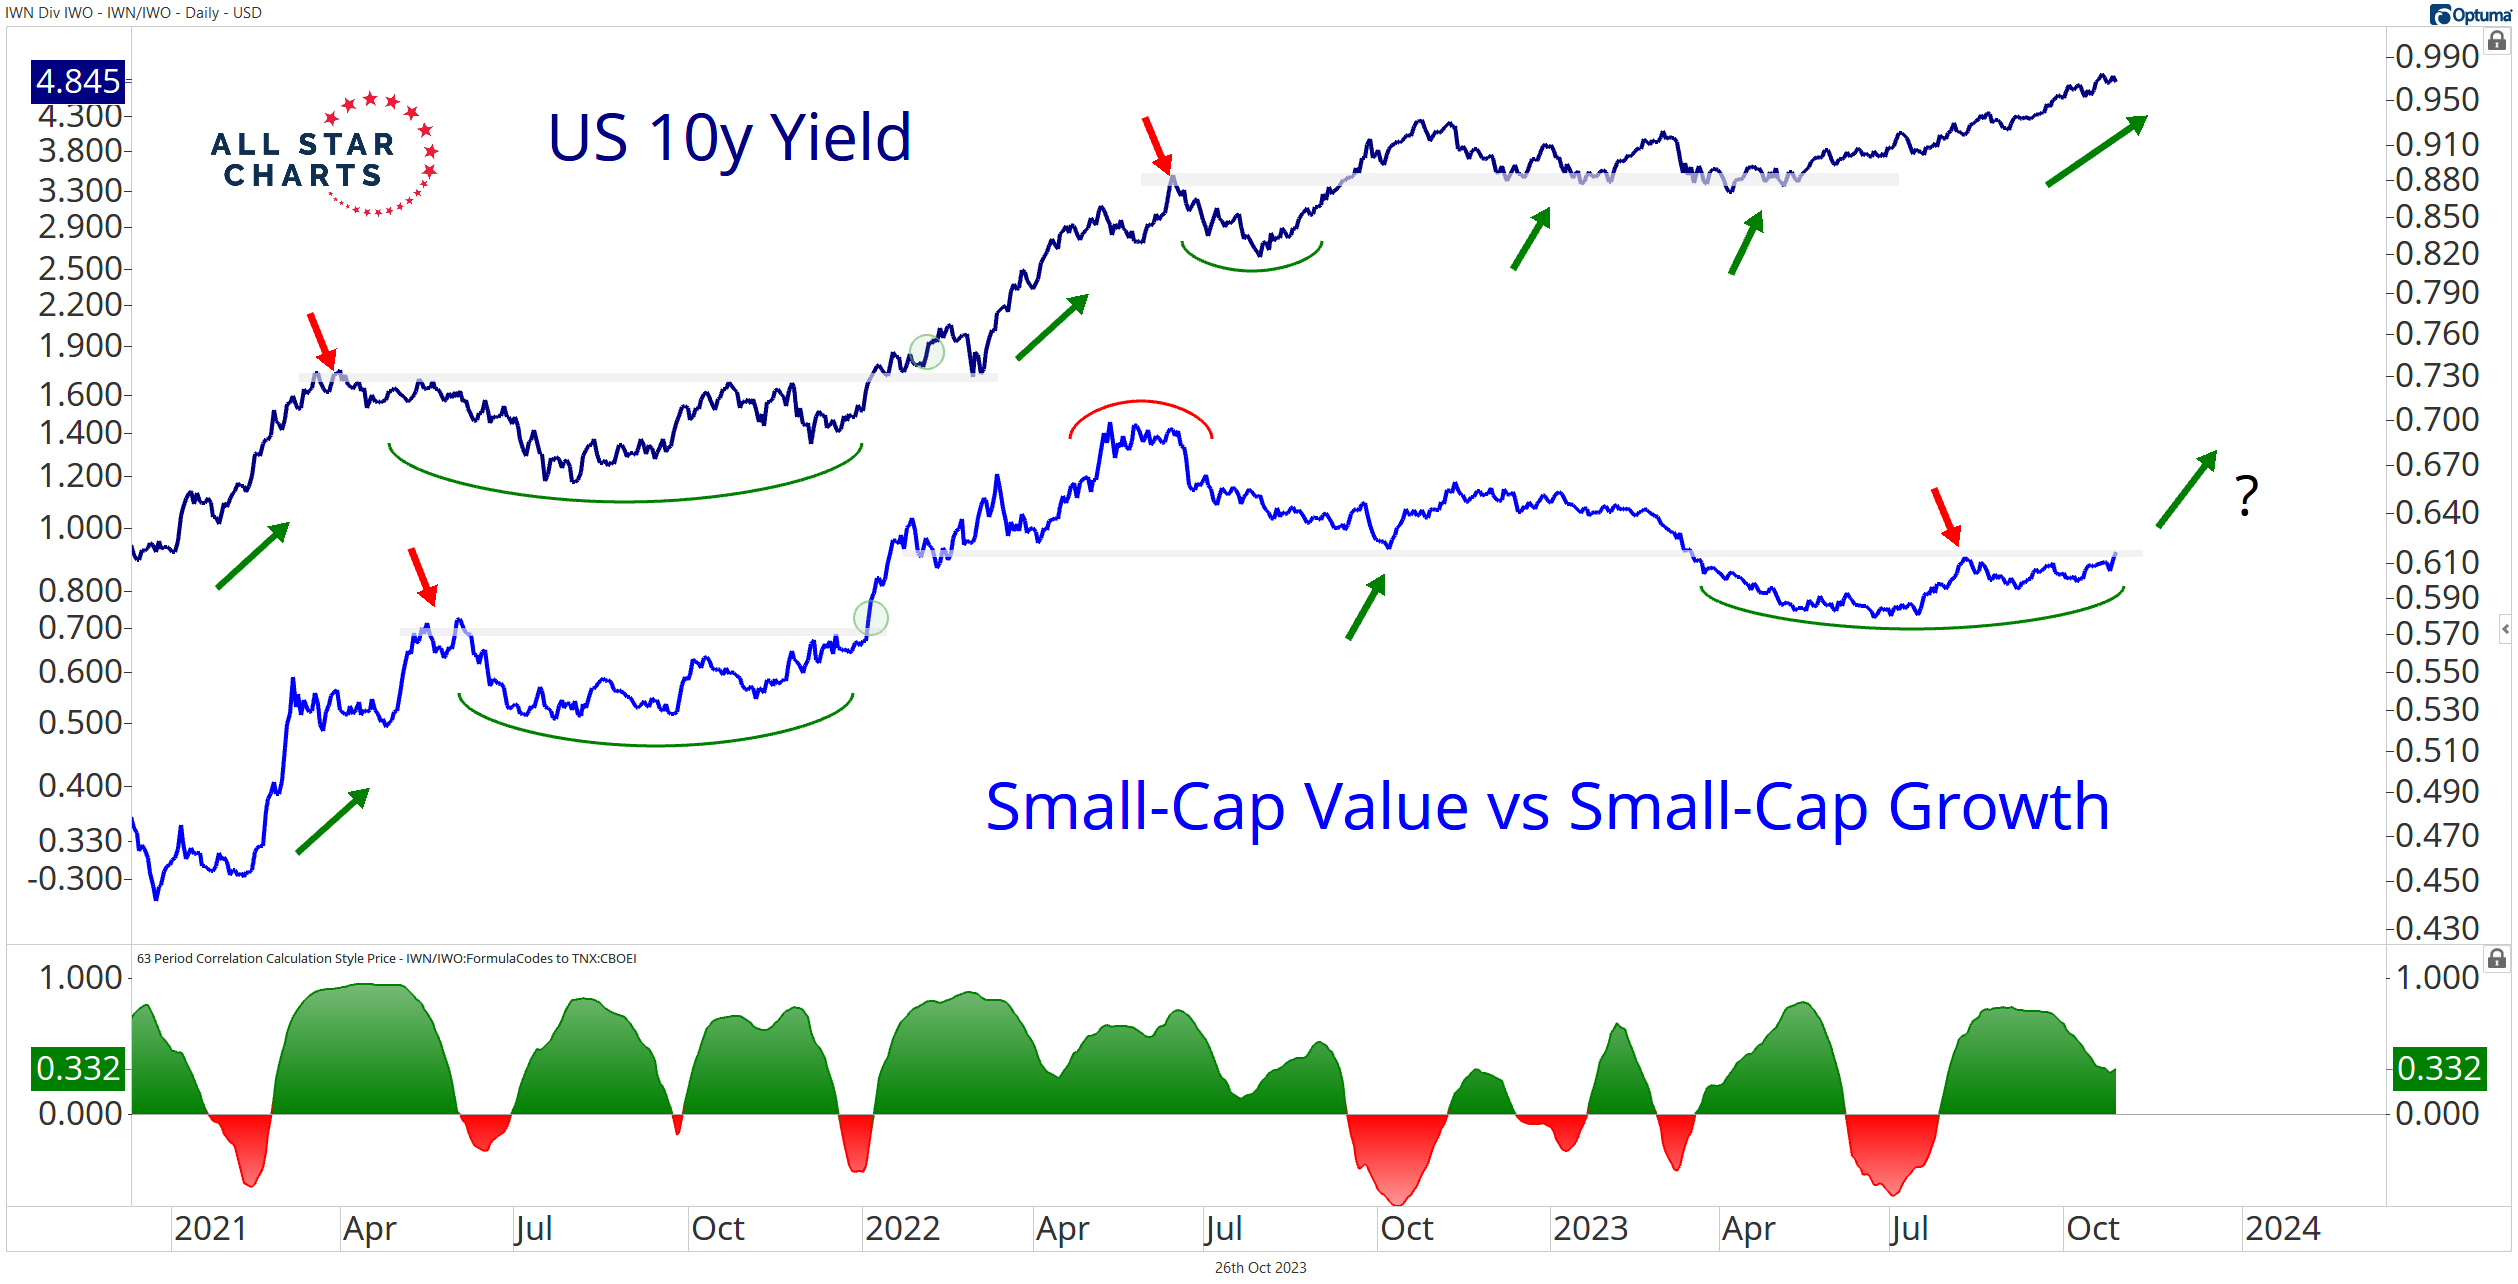
Notice the strong positive correlation between the US 10-year yield and the Small-cap Value ETF $IWN vs. the Small-cap Growth ETF $IWO in the lower pane.
IWN outperformed IWO during the previous increases in the 10-year yield. The market is still waiting for significant outperformance from IWN.
It doesn’t mean it won’t happen. Instead, it reveals that the market environment is indeed changing.
Like life, markets remain in constant flux. We aim to go with the flow and adapt to our ever-changing surroundings.
Yes, 2023 has been a far cry from 2022. And I imagine 2024 will keep us all on our toes.
But as US treasury yields continue to rip, many intermarket relationships mirror the action when rates soared last year.
Something to keep in mind as you tread lightly into the year end…
Stay tuned.
Countdown to FOMC
The market is pricing in a pause in the hiking cycle until late Q2 2024 as the probability of another hike by December decreases.
Here are the target rate probabilities based on fed funds futures:
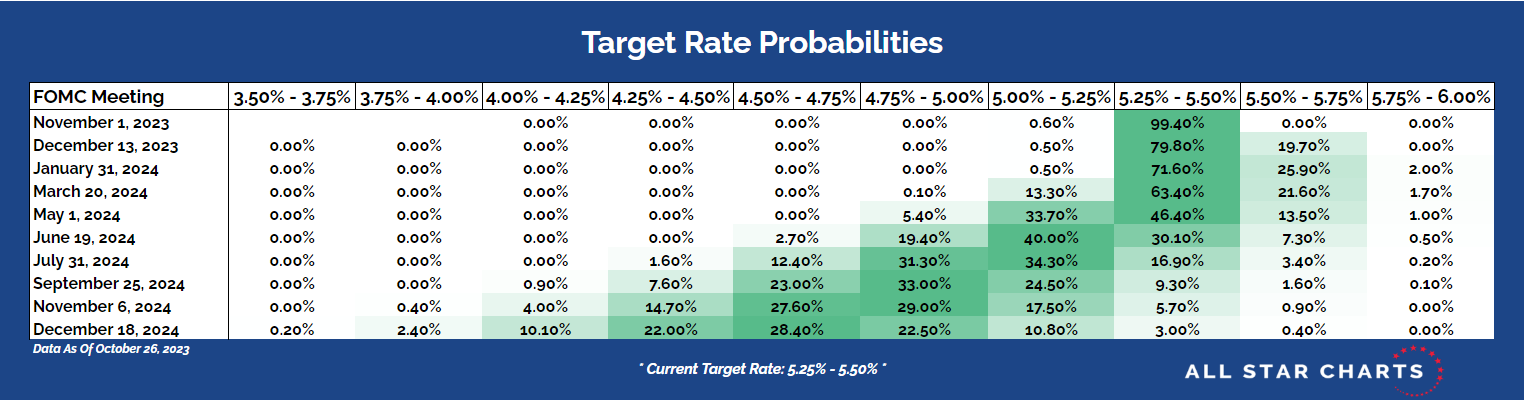
Click the table to enlarge the view.
This data is from the CME FedWatch Tool as of October 26, 2023.
Thanks for reading.
And as always, be sure to download this week’s Bond Report!
Premium Members can log in to access our Bond Report. Please log in or start your risk-free 30-day trial today.
Be the first to comment