

Scenario:
Suppose, we have a table FactSales, having the Sales details data, for 3 Years, FY14, FY15 and FY16.

Now based on the above source table “FactSales“, column “Order_Date” , we can generate the Dates Table using the below methods with DAX Expressions.
1) ADDCOLUMNS Method :
Using the AddColumns Function, along with Calendar Function, with the required Columns definition.
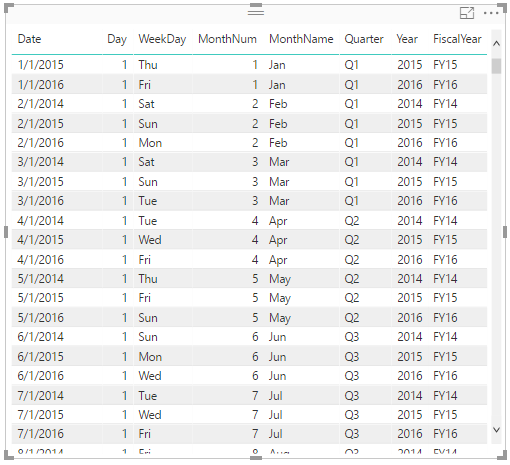
TblDates = ADDCOLUMNS(
CALENDAR( Min(FactSales[Order_Date]) ,Max(FactSales[Order_Date])),
“Day“, DAY([Date]),
“WeekDay“, FORMAT(WEEKDAY([Date]),”DDD”),
“MonthNum“, MONTH([Date]),
“MonthName“, FORMAT([Date],”MMM”),
“Quarter“, SWITCH(TRUE(), MONTH([Date]) IN {1,2,3} ,”Q1″,
MONTH([Date]) IN {4,5,6} ,”Q2″,
MONTH([Date]) IN {7,8,9} ,”Q3″,”Q4″),
“Year“, YEAR([Date]),
“FiscalYear“, “FY”&RIGHT(YEAR([Date]),2)
)
Result:

2) A) GENERATE Method – I:
Using the AddColumns Function, along with Calendar Function, with the required Columns definition.
TblCalendar = GENERATE (
CALENDAR( Min(FactSales[Order_Date]) ,Max(FactSales[Order_Date])),
VAR StartOfWeek = 1 // Where 1 is Sunday and 7 is Saturday, thus 3 would be Tuesday
VAR CurrentDay = [Date]
VAR DayNum = DAY( CurrentDay )
VAR WeekDayNum = WEEKDAY([Date])
VAR WeekDayName = FORMAT(WEEKDAY([Date]),”DDD”)
VAR MonthNum = MONTH ( CurrentDay )
VAR MonthName = FORMAT(CurrentDay,”MMM”)
VAR Quarter= SWITCH(TRUE(), MONTH([Date]) IN {1,2,3} ,”Q1″,
MONTH([Date]) IN {4,5,6} ,”Q2″,
MONTH([Date]) IN {7,8,9} ,”Q3″,”Q4″)
VAR YearNum = YEAR ( CurrentDay )
VAR FiscalQtr =”FY”&RIGHT(YearNum,2)& Quarter
VAR CurYear = YEAR( TODAY() )
VAR CurMonth = MONTH( TODAY() )
VAR DayIndex = DATEDIFF( CurrentDay, TODAY(), DAY) * -1
VAR TodayNum = WEEKDAY( TODAY() )
VAR WeekIndex = INT( ROUNDDOWN( ( DayIndex + (-1 * IF( TodayNum+
StartOfWeek<= 6 , TodayNum + StartOfWeek, TodayNum + StartOfWeek-7))) / 7,0))
RETURN ROW (
“DayNum”, DayNum,
“WeekDayNum”,WeekDayNum,
“WeekDayName”,WeekDayName,
“MonthNum”, MonthNum,
“MonthName”, MonthName,
“Quarter”, Quarter,
“Year”, YearNum,
“FiscalQtr”,FiscalQtr,
“Day Index”, DayIndex,
“Week Index”, WeekIndex,
“Month Index”, INT( (CurYear-YearNum) * 12 + MonthNum – CurMonth ),
“Year Index”, INT( CurYear-YearNum )
)
)
Result:

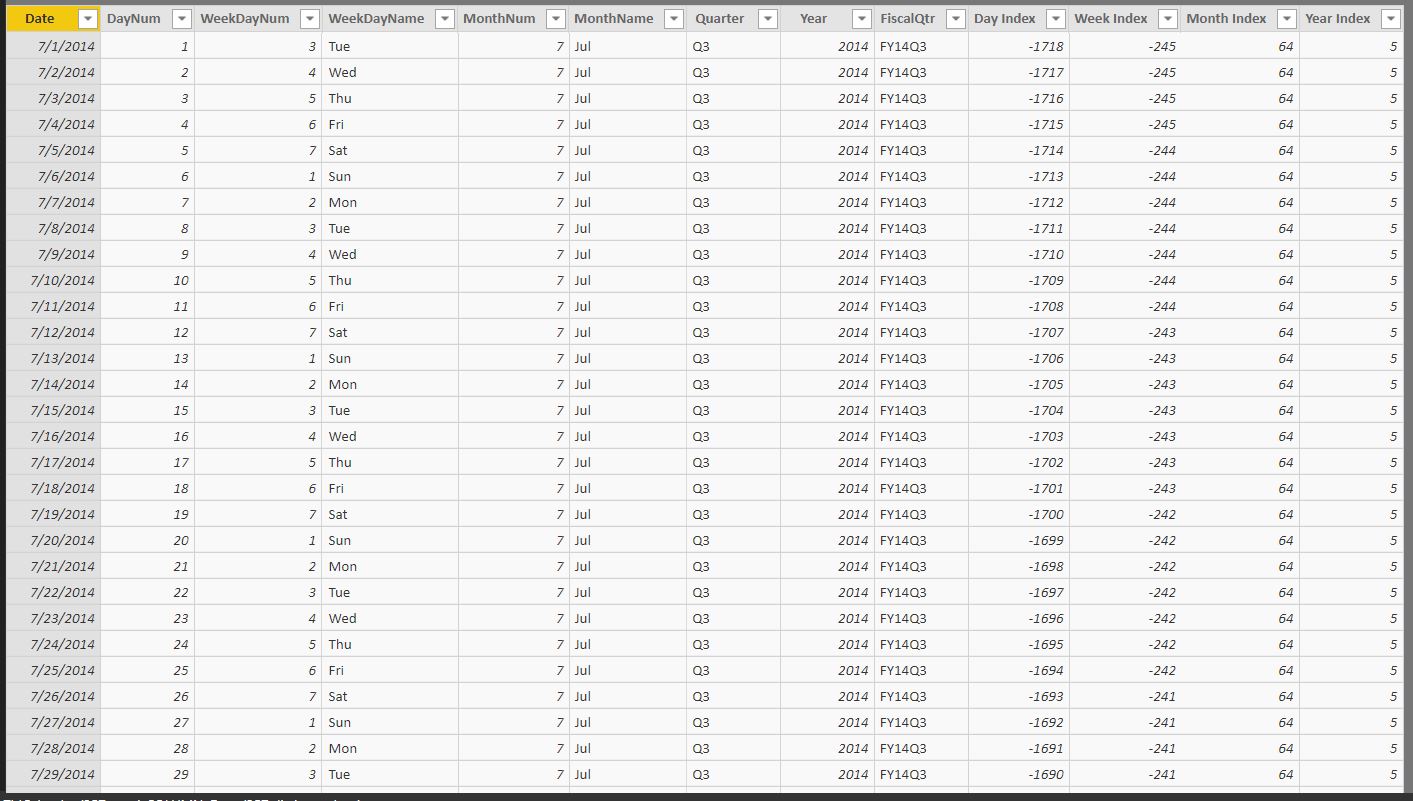
Notes:
In the above Table, the Indexes are calculated based on the Today () date.
2) GENERATE Method – II :
Ref_Calendar = VAR BaseCalendar=CALENDAR(MIN(tbl_Sales[Order_Date]),
MAX(tbl_Sales[Order_Date]))
RETURN
GENERATE(
BaseCalendar,
VAR _Date= [Date]
VAR _Year= YEAR(_Date)
VAR MthNum= MONTH(_Date)
VAR Mth_FY= CONCATENATE(CONCATENATE(
FORMAT(_Date,”mmm”),”-“),YEAR(_Date))
VAR Qtr= CONCATENATE(“Q”,ROUNDUP(MONTH(_Date)/3,0))
VAR Qtr_FY= CONCATENATE(CONCATENATE(
CONCATENATE(“Q”,ROUNDUP(MONTH(_Date)/3,0)),”-“),YEAR(_Date))
RETURN ROW(
“MthNum”, MthNum,
“Mth_FY”, Mth_FY
“Qtr”, Qtr
“QTR_FY”, Qtr_FY,
“Sort_Id”,_Year+MthNum+INT(RIGHT(_Year,2))*12
))
Result :

Notes:
The Sort_Id is used sort the Data to display by Mth_FY.
We can generate the Sort Ids for a Month, Quarter and Years, if we have the Year No in the data using the below logic. The Unique number for a Year can be like 1,2,3..in ascending order :
SortId_Month = (Mth_No)+Qtr_No)+(Year_No*19)
SortId_Qtr= (4*Qtr_No)+(Year_No*19)+1
SortId_Year= (Year_No*19)+18
——————————————————————————————————–
Thanks, TAMATAM ; Business Intelligence & Analytics Professional
——————————————————————————————————–
Be the first to comment