If you’ve been doing finance-related tasks, you’ve probably been asked to prepare aging of receivables or run a static report from an accounting system. In this blog post, I will explore how to replicate this report in Power BI (and showcase Power BI’s capability to generate random data without using an external data source).
Let’s start by creating our fact table. Head over to the query editor and select a blank query as the data source. In the advanced editor, delete the default contents and paste the following code:
let
    startdate = #date(2021,7,1),
    enddate = Date.From(DateTime.FixedLocalNow()),
    step = Number.From( enddate - startdate ) + 1,
    Source = List.Dates(startdate, step , #duration(1,0,0,0)),
    #"Converted to Table" = Table.FromList(Source, Splitter.SplitByNothing(), null, null, ExtraValues.Error),
    #"Renamed Columns" = Table.RenameColumns(#"Converted to Table",{{"Column1", "Transaction Date"}}),
    #"Changed Type" = Table.TransformColumnTypes(#"Renamed Columns",{{"Transaction Date", type date}}),
    #"Added Custom" = Table.AddColumn(#"Changed Type", "CustomerNumbers", each let
start = Number.Round ( Number.RandomBetween ( 1, 10 ), 0),
end = Number.Round ( Number.RandomBetween ( 20, 50 ), 0)
in {start..end}, type list),
    #"Expanded CustomerNumbers" = Table.ExpandListColumn(#"Added Custom", "CustomerNumbers"),
    #"Changed Type1" = Table.TransformColumnTypes(#"Expanded CustomerNumbers",{{"CustomerNumbers", Int64.Type}}),
    #"Added Custom1" = Table.AddColumn(#"Changed Type1", "Sales on Credit", each let
start = Number.RandomBetween ( 10, 20 ),
end = Number.RandomBetween ( 100, 200 ),
sign = Number.RandomBetween ( -2, 3 )
in Number.RandomBetween ( start, end ) * sign, type number),
    #"Added Custom2" = Table.AddColumn(#"Added Custom1", "Customer", each let
x = Text.From([CustomerNumbers]),
y = Text.PadStart(x, 2, "0" )
in "Customer " & y, type text),
    #"Reordered Columns" = Table.ReorderColumns(#"Added Custom2",{"Transaction Date", "Customer", "CustomerNumbers", "Sales on Credit"}),
    #"Removed Columns" = Table.RemoveColumns(#"Reordered Columns",{"CustomerNumbers"}),
    #"Added Index" = Table.AddIndexColumn(#"Removed Columns", "Index", 1, 1, Int64.Type),
    #"Added Custom3" = Table.AddColumn(#"Added Index", "Invoice Number", each "INV" & Text.PadStart( Text.From ( [Index] ), 10, "0" ), type text),
    #"Removed Columns1" = Table.RemoveColumns(#"Added Custom3",{"Index"})
in
    #"Removed Columns1"
Name this table FactSalesOnCredit before loading it.
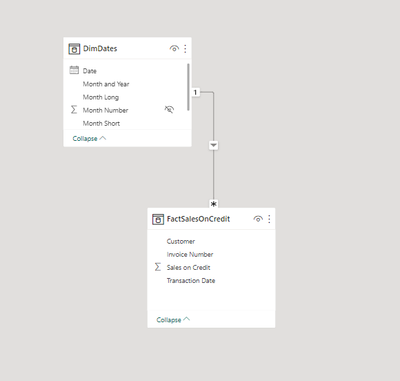
Next Let’s create our dates table in DAX and name it DimDates. Use the formula below:
DimDates =
VAR __BASE =
    CALENDAR (
        MIN ( FactSalesOnCredit[Transaction Date] ),
        MAX ( FactSalesOnCredit[Transaction Date] )
    )
RETURN
    ADDCOLUMNS (
        __BASE,
        "Year", YEAR ( [Date] ),
        "Month Short", FORMAT ( [Date], "mmm" ),
        "Month Long", FORMAT ( [Date], "mmmm" ),
        "Month Number", MONTH ( [Date] ),
        "Month and Year", FORMAT ( [Date], "mmm-yy" ),
        "YYYYMM", FORMAT ( [Date], "YYYYMM" )
    )
Once DimDates is created, sort the following columns:
- Month and Year by YYYYMM
- Month Long and Month Short by Month Number
Create a one-to-many relationshiop between Date column in DimDates and Transaction Date in FactSalesOnCredit. You may choose to hide Transaction Date from report view to make it look cleaner. We’ll be using Date going forward.
Let’s create another table in DAX without a relationship to fact or dates table. Let’s call it AgeTable. This will hold the age and their corresponding category or bucket.
AgeTable =
VAR __max =
    TODAY () - MIN ( FactSalesOnCredit[Transaction Date] ) + 1
VAR __BASE =
    SELECTCOLUMNS ( GENERATESERIES ( 0, __max, 1 ), "Age", [Value] )
RETURN
    ADDCOLUMNS (
        __BASE,
        "Age Category",
            SWITCH (
                TRUE (),
                [Age] <= 30, " 0-30 days",
                [Age] <= 60, " 31 - 60 days",
                [Age] <= 90, " 61 - 90 days",
                [Age] <= 120, "91 - 120 days",
                "over 120 days"
            )
    )
And one more table where we will keep our measures.
**MEASURES =
ROW ( "Ignore", BLANK() )
//serves as a container of measures
Let us start creating our measures.
Sum of Sales on Credit =
SUM ( FactSalesOnCredit[Sales on Credit] )
Running Sales on Credit =
//to calculate the cumulative amount of sales at a given date
//unless a specific date is selected, selecting a period (month, quarter, etc) will return the cumulative amount as at max date within that period.
CALCULATE (
[Sum of Sales on Credit],
FILTER ( ALL ( DimDates ), DimDates[Date] <= MAX ( DimDates[Date] ) )
)
Receivables by Age =
VAR __MAX_DATE =
    MAX ( DimDates[Date] )
VAR __START =
    __MAX_DATE - CALCULATE ( MAX ( AgeTable[Age] ), ALLEXCEPT ( AgeTable, AgeTable[Age Category] ) )
VAR __END =
    __MAX_DATE - CALCULATE ( MIN ( AgeTable[Age] ), ALLEXCEPT ( AgeTable, AgeTable[Age Category] ) )
RETURN
    CALCULATE (
        [Running Sales on Credit],
        DATESBETWEEN ( DimDates[Date], __START, __END )
    )
Dissecting Receivables by Age Measure –
Assuming the selected month is October, the Year is 2021 and Age Category is 0-30 days
- VAR __MAX_DATE would be Oct. 31, 2021. It is simply the maximum date in the current filter context – the last date of the month for month slicers or the date in the current row/column in a table and matrix.
- VAR __START would be Oct. 31, 2021 less 30 days (as the max Age for 0-30 days is 30) or Oct. 1, 2021.
- VAR __END would be Oct. 31, 2021 less 0 day (as the min Age for 0-30 days is 0) or Oct. 31, 2021.
The measure then returns the Running Sales on Credit where DimDate[Date] is between __START and __END date variables.
After we’re done with the measures we can then use them in visuals and start using and sharing the report.
Please see attached pbix for your reference.


Be the first to comment