Power BI Blog: Dynamic Format Strings for Measures
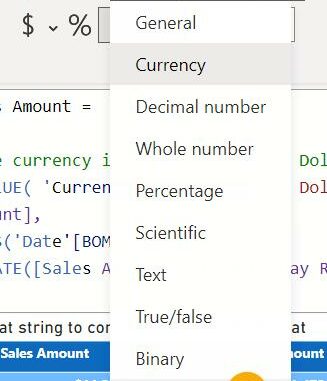
Welcome back to this week’s edition of the Power BI blog series. This week, we look at the new dynamic format strings for measures. Ever wanted to format a measure differently based upon a […]
Recently when I was exploring the AI-driven out-of-the-box customer service reports “Customer Service Historical Analytics”, “Knowledge Analytics”, and “Omni-channel historical analytics”. I saw the newly added functionality in the report named “Bookmarks”. The “Bookmarks” […]
How to create a Summary table with Group By columns from Related Tables in Power BI Scenario: We wants to create a Sales Summary using the facts from “tbl_Sales” and dimensions(group by columns) from the […]
Python programming language offers a unique set of tools that makes coding not only fun but also accelerate your progress as a programmer. Due to its ease of use, Python has become the go-to language […]
Welcome back to this week’s edition of the Power BI blog series. This week, we consider the changes to ORDERBY and its impact upon associated functions. Deep breath – this is a long one! Back […]
There is a lot of custom visualizations that you can use to make a report. Power BI offers a good set of in-built visuals such as 1.line chart 2.bar chart 3.funnel chart 4.KPI 5.map 6.pie […]
Roles in the Power BI WorkspacesThe Roles let us manage who can do what in the new workspaces, so teams can collaborate. New workspaces allow you to assign roles to individuals, and to user groups: […]
When working with Power BI, creating a date table can be a valuable asset for your data analysis and visualization tasks. Date tables enable you to filter, group, and analyze time-based data effectively. In this […]
Welcome back to this week’s edition of the Power BI blog series. This week, we inspect two new DAX functions, RANK and ROWNUMBER. Two new functions have been added to the DAX / Power BI repertoire […]
To do this, firstly, we need to create a new measure. Hide Visuals = IF(SELECTEDVALUE(‘Table’[Country]) in {“Japan”,“Kenya”},1,0) Then we need to select visual 2 and put this Hide Visual measure on visual filter and give condition […]
© Copyright 2023 QuantInsightsNetwork