

From the Desk of Ian Culley @IanCulley
Commodities are making moves.
Cotton is forming a bull flag following last week’s breakout. Coffee futures are coiling below a critical polarity zone. Cattle and hogs are running wild. Even Dr.Copper is perking up, posting positive returns over the trailing five days.
And don’t forget about cocoa futures as they continue to print fresh all-time highs.
With all this action heating up, let’s turn our attention to one of 2021’s most explosive markets…
Lumber.
Remember all the lumber memes on Twitter?
Dudes were posting their W’s sitting atop stacks of 2x4s and plywood. I’ll never forget it.
As a trader, I prefer to avoid lumber futures. It’s a thin market. But I can’t ignore the yearlong base forming on the daily chart:
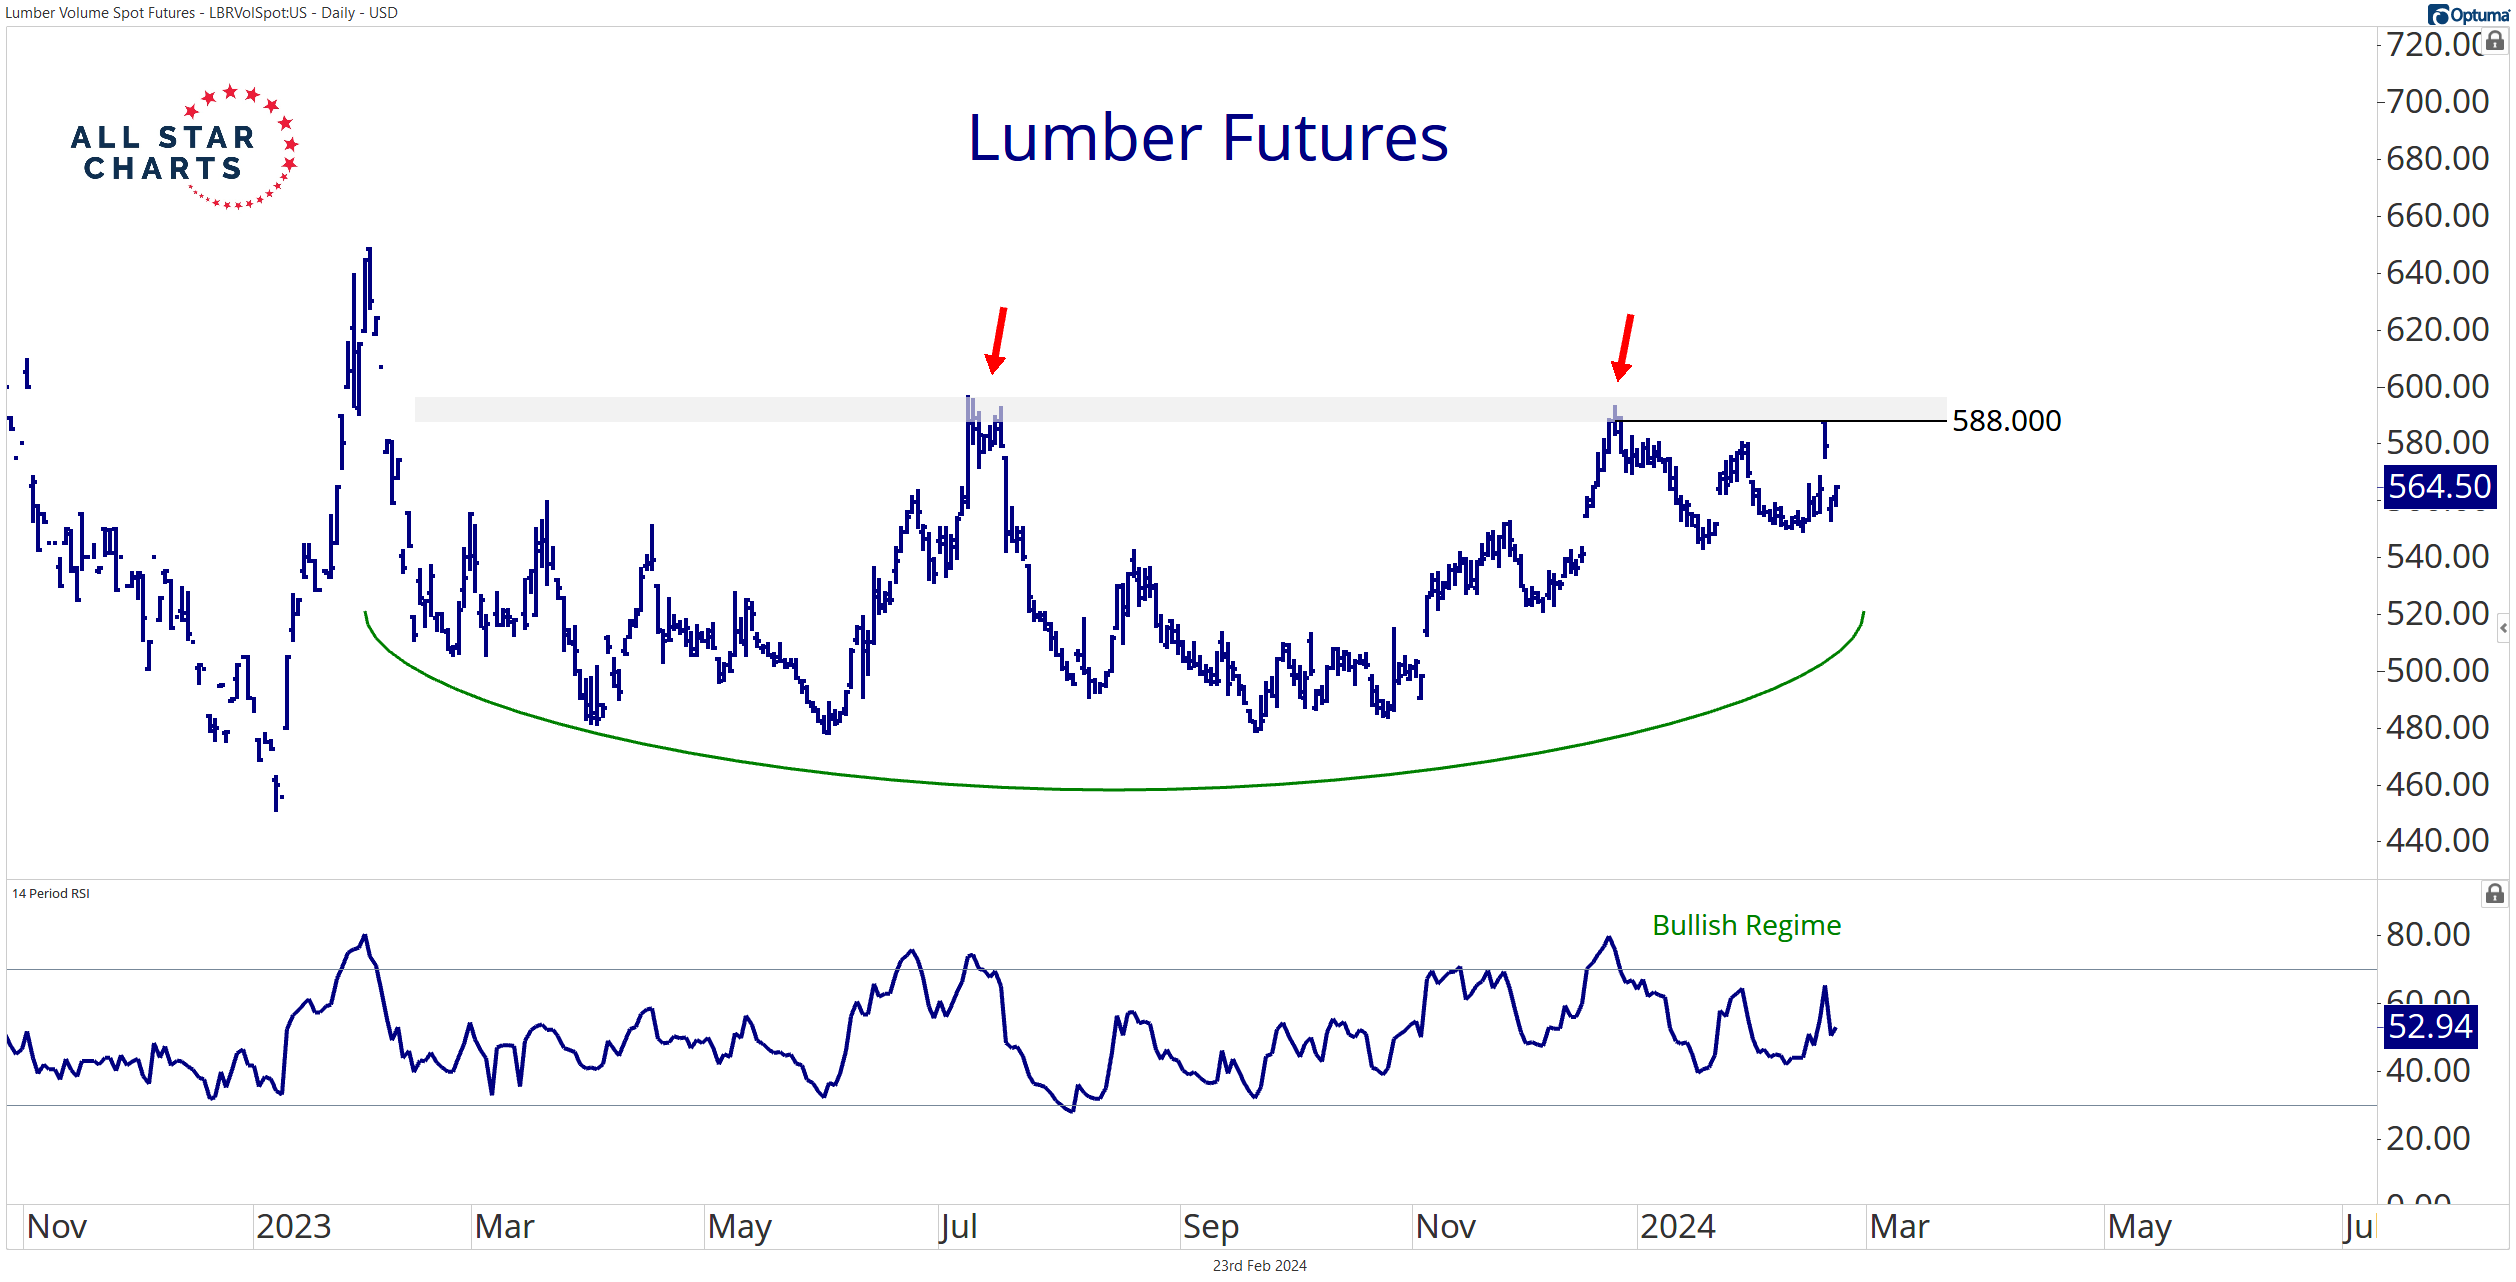
Buyers are running into resistance at a shelf of former highs. A decisive close above 588.0 (Dec. closing high) flashes a buy signal.
Last year’s high stands as a logical initial target at approximately 650.0.
If lumber is in your wheelhouse, have a go. I won’t be taking this trade. It’s not for me.
Instead, I’m more interested in the information lumber futures provide.
Zooming out on a monthly chart…
Lumber futures are finding support at a former multi-decade resistance level after skyrocketing to new all-time highs in 2021.
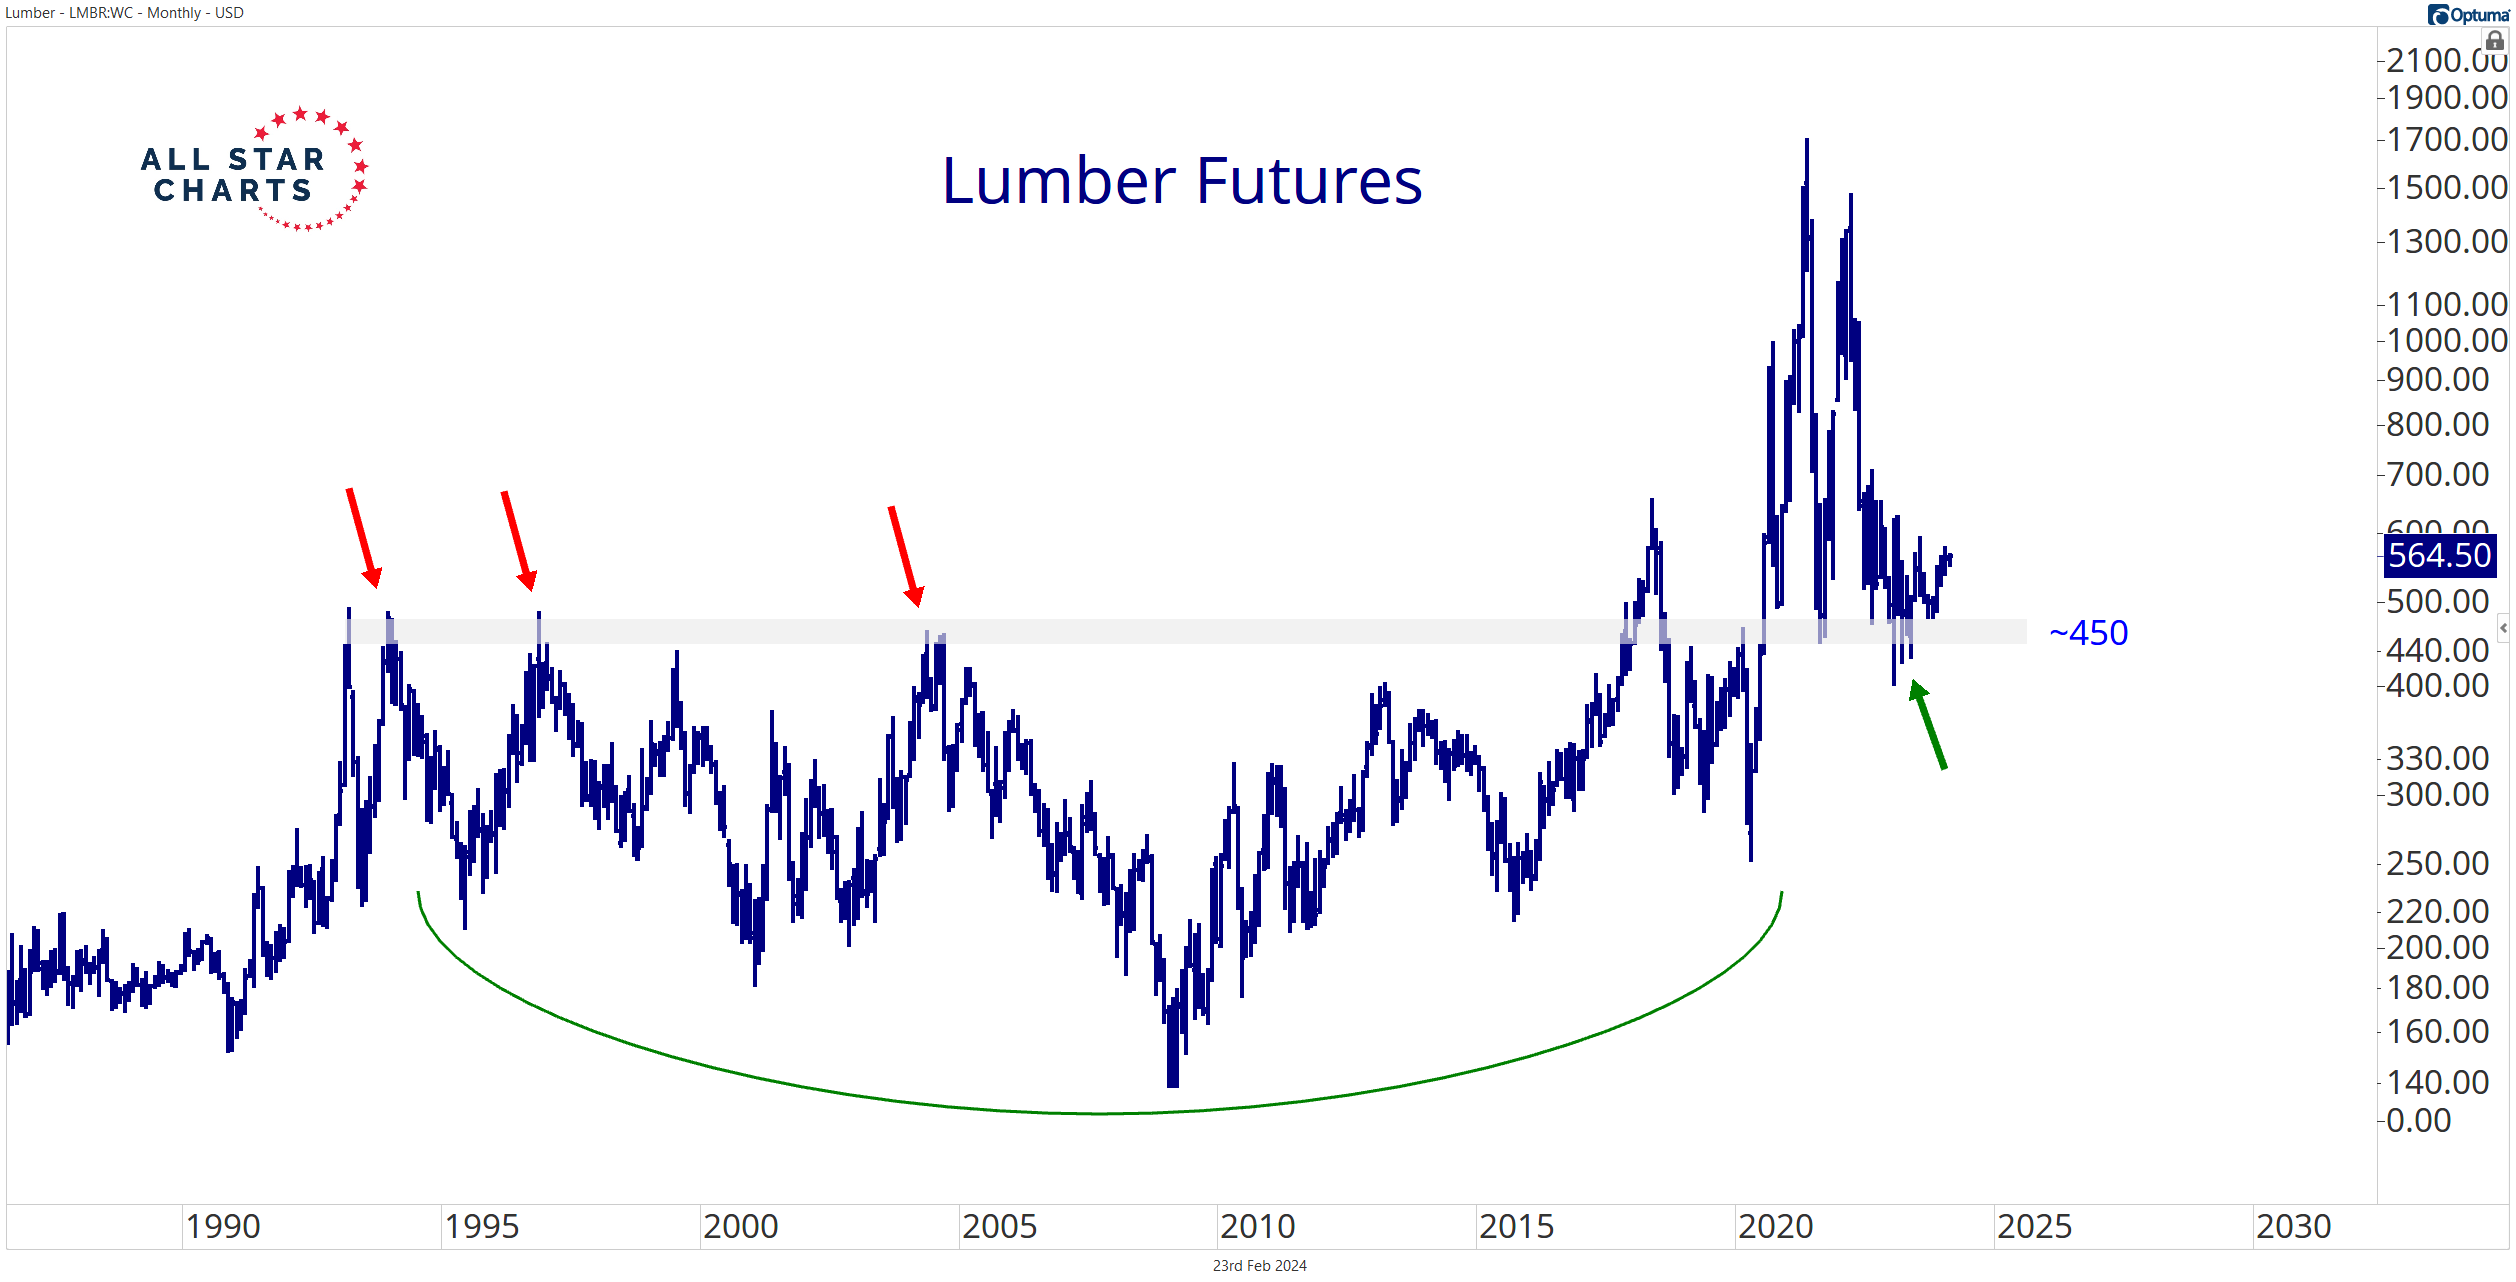
I view the 450 level as the lower bounds of a new generational range for lumber.
Other commodities will follow suit, breaking to new all-time highs while forming ranges that will define the coming decades.
It’s the type of price discovery that accompanies commodity supercycles.
On the other hand, lumber below 450 raises serious doubts regarding the current commodity bull run. It also wouldn’t support a healthy demand for economic-sensitive homebuilders.
There’s plenty to gain from tracking lumber’s next move, whether you choose to trade it or not.
But if you’re simply looking for a vehicle to express a bullish thesis for lumber, I have a setup for you in today’s commodity Trade of the Week…
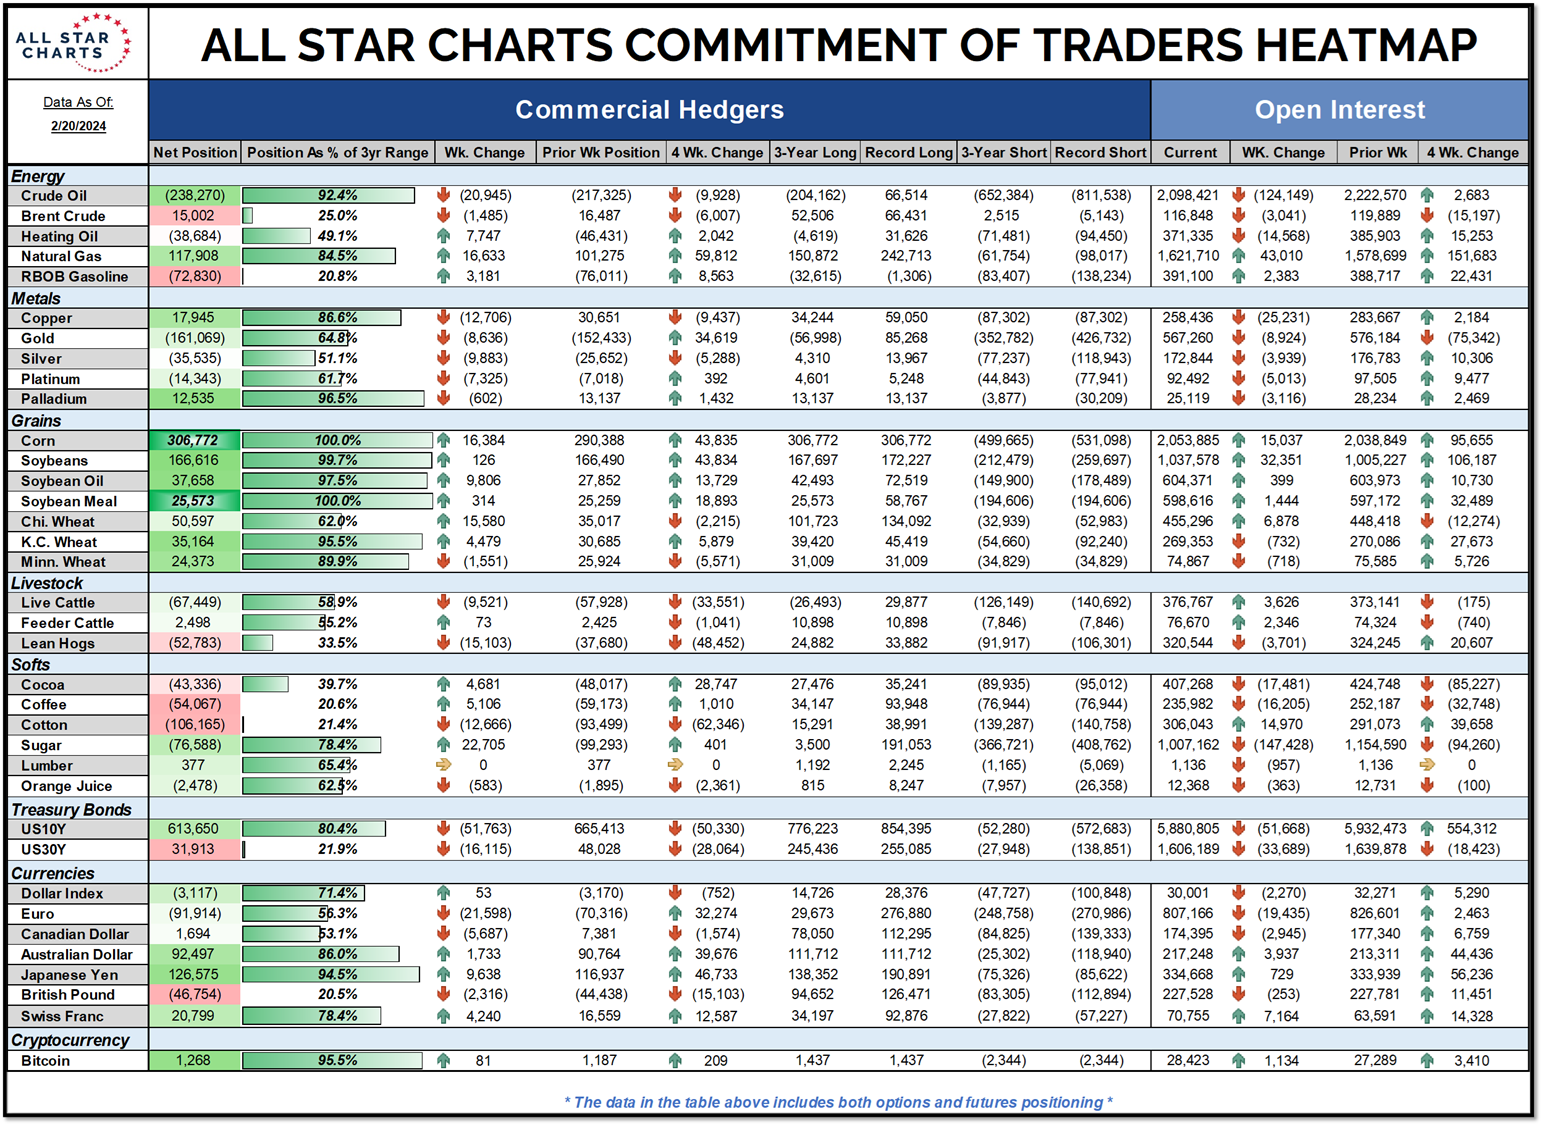
COT Heatmap Highlights
- Commercial hedgers post another record-long position in corn.
- Commercials’ long exposure to the Japanese yen falls within six percent of a new three-year extreme.
- Commercial notch yet another record-long position for palladium, adding more than 2,000 contracts last week.
Click here to download the All Star Charts COT Heatmap.
Premium Members can log in to access our Weekly Commodities Report Chartbook and the Trade of the Week. Please log in or start your risk-free 30-day trial today.
Be the first to comment