

Welcome
back to this week’s edition of the Power BI blog series. This week, we look at ways of enhancing your
custom visual’s performance.
If you’re interested in creating your
own visuals in Power BI, then this article is for you! Microsoft has announced techniques to improve
the performance of custom visuals, discussing the performance improvements made
in both visual rendering and load times.
They have identified and addressed certain bottlenecks in the code, and
these improvements are available for any visual that has been updated to API
version 4.2 and onwards. Along with
these fixes, Microsoft has also provided code practices and techniques that can
greatly enhance the performance of rendering custom visuals. It is recognised that getting the visual to
render as quickly as possible is critical when writing the code.
Having said all this, as the Power BI
platform continues to be improved and enhanced, new versions of the API will
constantly be released. In order to get
the most out of the Power BI visuals’ platform and feature set, it is recommended
that you keep up-to-date with the most recent version. To find out which version you’re using, check
the aversion in the pbiviz.json file.
In the meantime, here are some
recommendations for achieving optimal performance for your custom visual.
Reduce Plugin Size
A smaller custom visual plugin size
results in:
- faster download
times - faster installation
whenever the visual is run.
Check Render Time of the Visual
Measure the render time of your visual
in various situations to see which, if any, parts of the script require optimisation.
Power BI Desktop Performance Analyzer
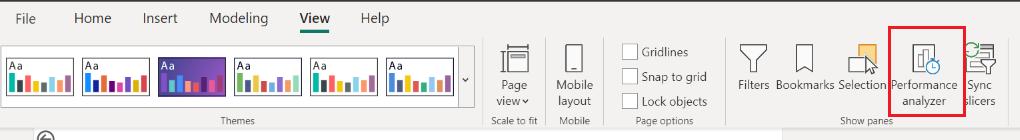
Use the Power BI Desktop Performance Analyzer(sic) (View -> Performance Analyzer) to check how your visual
renders in the following cases:
- first render of the
visual - thousands of data
points - a single data point
/ measure (to determine the visual render overhead) - filtering
- slicing
- resizing (this may
not work in the Performance Analyzer).
If possible, compare these measurements
with those of a similar core visual to see if there are parts that may be
optimised.
Use the User Timing API
Use the User Timing API to measure your
app’s JavaScript performance. This API
can also help you decide which parts of the script need optimisation.
Other Ways to Test Your Custom Visual
There are various ways to test you
custom visual:
- code instrumentation:
use the following console third party tools to gather data about your custom
visual’s performance: - console.log()
- console.dir()
- console.time()
- console.timeEnd()
- the following web
developer tools may also help measure your visual’s performance, but keep in
mind that they profile Power BI as well: - Metrics
- JavaScript profiler.
Once you determined which parts of your
visual need optimisation, you can then implement these further tips.
Update Messages
When you update the visual:
- don’t re-render the
entire visual if only some elements have changed. Render only the necessary elements - store the data view
passed on update. Render only the data
points that are different from the previous data view. If they haven’t changed, there’s no need to re-render
them - resizing is often
done automatically by the browser and doesn’t require an update to the visual.
Cache DOM Nodes
When a node or list of nodes is
retrieved from the DOM (Data Object Model), think about whether you can reuse
them in later computations (sometimes even the next loop iteration). As long as you don’t need to add or delete
more nodes in the relevant area, caching them can improve the application’s
overall efficiency.
To make sure that your code is fast and
doesn’t slow down the browser, keep DOM access to a minimum. For example, instead of:
JavaScript
public update(options: VisualUpdateOptions) {
let axis =
$(“.axis”);
}
JavaScript
public constructor(options: VisualConstructorOptions) {
this.$root = $(options.element);
this.xAxis =
this.$root.find(“.xAxis”);
}
public update(options: VisualUpdateOptions) {
let axis = this.axis;
}
Avoid DOM Manipulation
Limit DOM manipulations as much as
possible. Insert operations like prepend(),append() and after() are time-consuming and should only be used
when necessary. For example, iInstead
of:
JavaScript
for (let i=0; i<1000; i++) {
$(‘#list’).append(‘<li>’+i+'</li>’);
}
try making the above example faster by
using html() and building the list beforehand:
JavaScript
let list=””;
for (let i=0; i<1000; i++) {
list +=
‘<li>’+i+'</li>’;
}
$(‘#list’).html(list);
Reconsider JQuery
Limit JS frameworks and use native JS
whenever possible to increase the available bandwidth and lower your processing
overhead. Doing this might also decrease
compatibility issues with older browsers.
Animation Options
For repeated use of animations, consider
using Canvas or WebGL instead of SVG. Unlike
SVG, with these options, performance is determined by size rather than content.
Canvas Performance Tips
You should read up on third party sites
for tips on improving canvas performance, such as”
- faster load times
- improving HTML5
Canvas performance - optimising canvas
generally.
Animation Functions
Use requestAnimationFrame to
update your on-screen animations, so your animation functions are called before
the browser calls another repaint.
Animation Loops
Does the animation loop redraw
unchanged elements? If so, it wastes
time drawing elements that don’t change from frame-to-frame. Instead, you should update the frames
selectively.
When you’re animating static visualisations,
it’s tempting to lump all the draw code into one update function and repeatedly
call it with new data for each iteration of the animation loop. Instead, consider using a visual constructor
method to draw everything static. Then,
the update function only needs to draw visualisation elements that change.
In particular, Microsoft has noted that
inefficient animation loops are often found in axes and legends.
Common issues
- Text size
calculation: when there are a lot of data points, don’t waste time calculating
text size for each point. Calculate a
few points and then estimate - If some elements of
the visual aren’t seen in the display, there’s not need to render them.
In the
meantime, please remember we offer training in Power BI which you can find out
more about here. If you wish to catch up on past articles, you
can find all of our past Power BI blogs here.
Be the first to comment