

Welcome back to
this week’s edition of the Power BI blog series. This week, we look at how to deal with pivoted
data that has two rows of headings.
When dealing with pivoted data, it is
common to come across double headers, i.e., where two rows of text make
up the table heading(s). For example,
the following table contains sales data from different countries on different
products, and a sub-category Product Type:
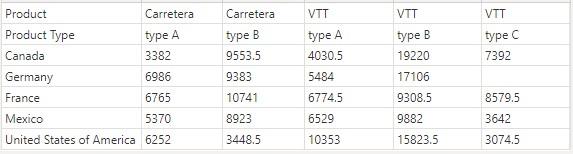
Each column is a unique Product Type of some product, e.g., the second column represents ‘type B’ of
the product ‘Carretera’. We might
want to drill down to the most granular level, to have a simple two-dimensional
table with row and column headers. However,
we can’t simply remove Product, since it wouldn’t make sense to have ‘type
A’, ‘type B’ and ‘type C’ as column headers.
That means we need to merge Product and Product Type. How do we do
that? When size of the data is small, we
can simply transpose the table and merge.
Continuing from the above table, we can go into Power Query Editor and
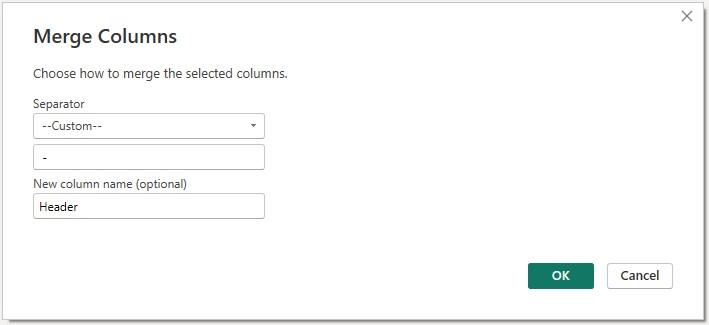
first transpose the table. Then to merge Product and Product Type (columns now), we hold down CTRL key to select them, and in Transform -> Text Column we click Merge
Columns to pop up the following dialogue box:
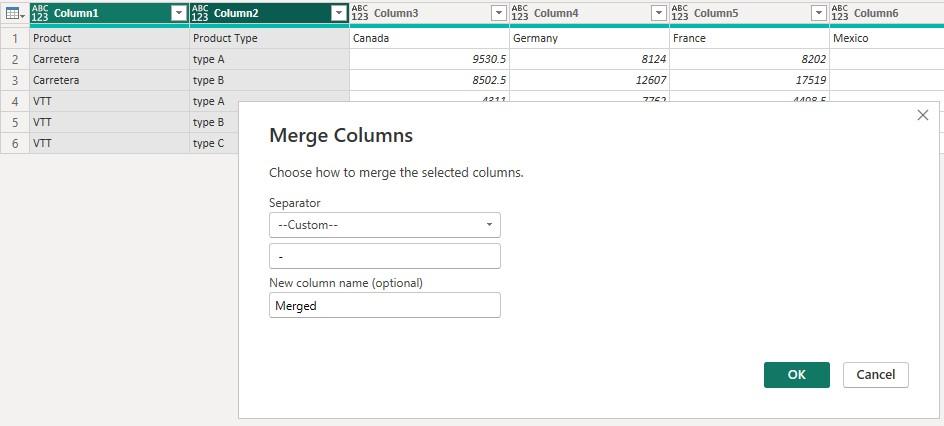
We can specify a separator and a new column
name to merge the two [2] columns. Transposing
back, we have the following table:
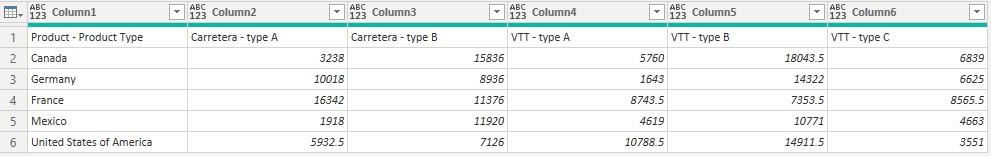
for which we can promote the headers and
continue from there.
But what if the data is humongous? It is not uncommon to have thousands or
millions of rows of data in real datasets, and it is hardly a good idea to
transpose such datasets as done for the above. There is a better way to do it, which we will demonstrate using a dataset of child account
spendings with 120,000 rows of fake data.
Extracting
Headers
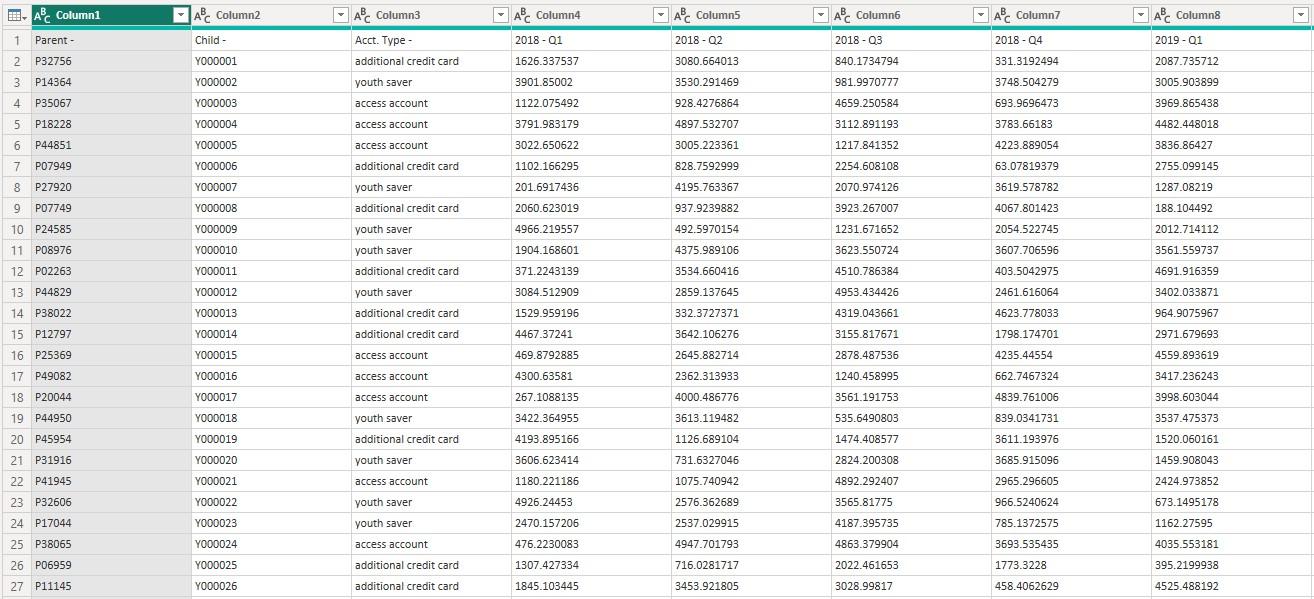
This is a snippet of the dataset:
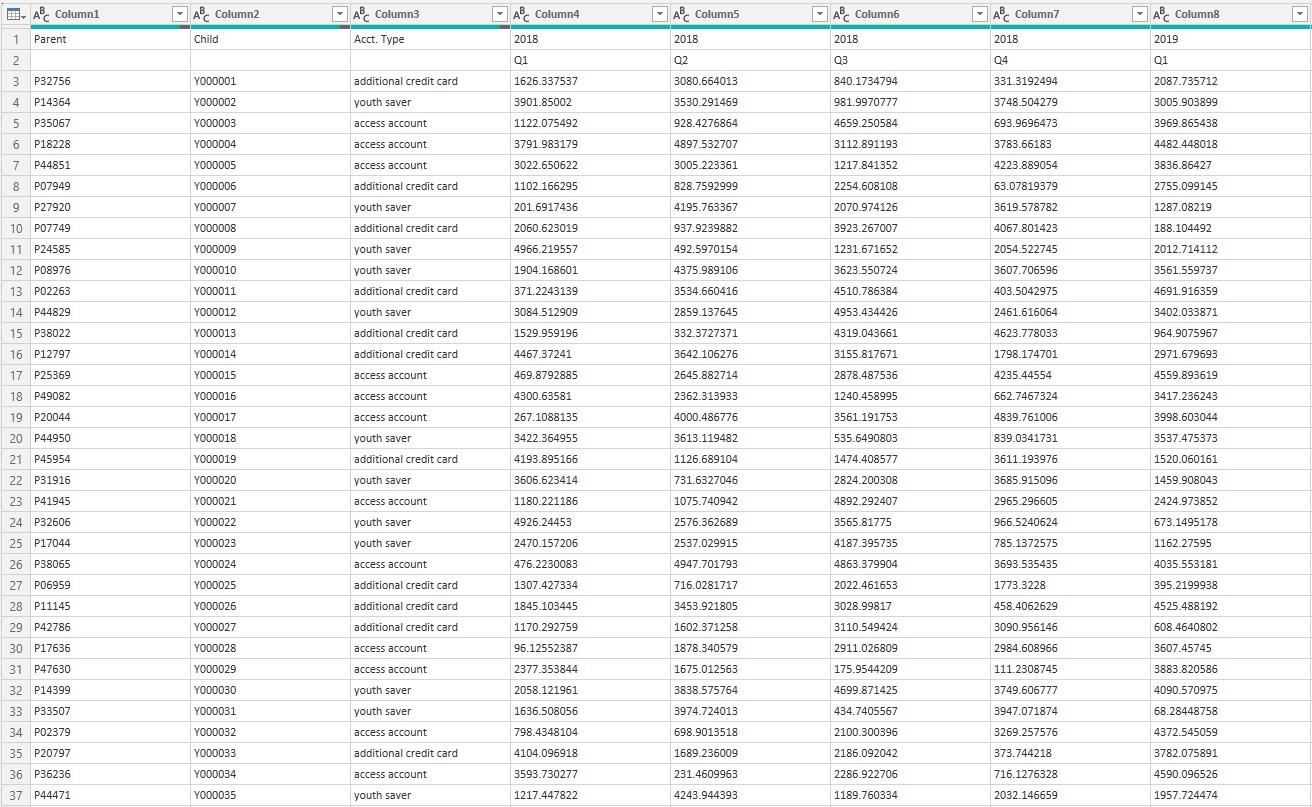
The first two [2] columns contain account
numbers of the child accounts and their linked parent accounts. The third column describes types of the child
accounts. Other columns contain
quarterly spendings from 2018 to 2022. We
generated 120,000 rows of random numbers and size of the dataset is close to 31
megabytes.
The same problem of having double headers
occurs here. Both of the first two [2]
rows are necessary, and we would like to obtain a merged row of headers in the
form ‘Year – Quarter’. The gist of our
technique is to extract only the first two [2] rows, transpose and merge them,
and then insert the merged headers back into the table. We have developed a module of Power Query M :
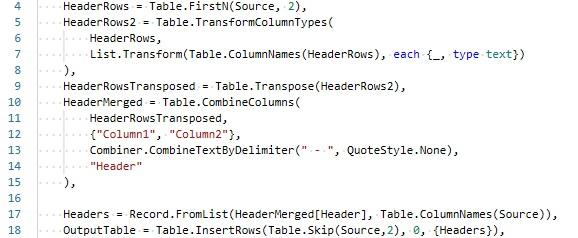
Let’s go through the code.
We use the Power Query M function Table.FirstN to extract the two [2] rows of headers from Source, the original table:
HeaderRows
= Table.FirstN(Source, 2),
and in the next line we specify all columns
to be type text so we can merge later:
HeaderRows2
= Table.TransformColumnTypes(HeaderRows,
List.Transform(Table.ColumnNames(HeaderRows), each {_, type text})),
The function Table.TransformColumnTypes is the corresponding function for changing data type for columns, and its
second argument expects a list of lists in the format:
{{column1
name, type name}, {column2 name, type name}, …}
Here, we use List.Transform and Table.ColumnNames functions to transform all columns at once, without listing names of all
columns. The function Table.ColumnNames returns names of the columns in the table HeaderRows as a list of text,
and the function List.Transform transforms the list to a list of lists,
to use as the second argument in Table.TransformColumnTypes.
The next two [2] functions, Table.Transpose and Table.CombineColumns, come from transposing and merging actions. Let’s have a look. In Transform -> Table, we can click Transpose and the two [2] header rows become:
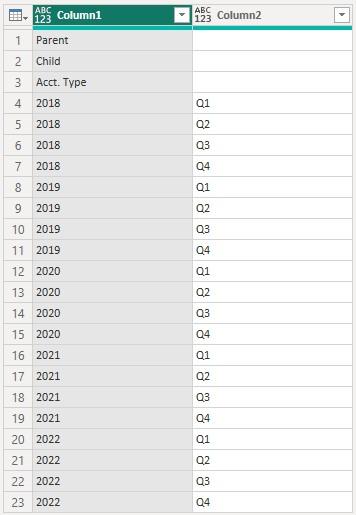
Then, we hold down the CTRL key to
select the two [2] columns, and in Transform -> Text Column, we click Merge Columns and specify a separator and a name for the output column:
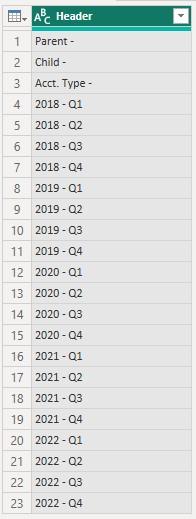
At this point we have obtained the merged
headers that we wanted.
To insert the merged headers back into the
data table, we use three [3] functions: Record.FromList, Table.InsertRows and Table.Skip. The first line of M code:
Headers
= Record.FromList(HeaderMerged[Header], Table.ColumnNames(Source)),
first uses square brackets ([]) to
extract column Header from table HeaderMerged as a list, and then
the function Record.FromList converts the list into a record, with
column names of the original table Source as field names. The second line of M code:
OutputTable
= Table.InsertRows(Table.Skip(Source,2), 0, {Headers}),
The inner-most function Table.Skip excludes the first two [2] (unmerged) header rows of the original table. Specifying a zero [0] at the second argument,
the function Table.InsertRows inserts at the beginning of the “unheaded”
table a list containing the record Headers.
This is a snippet of the output table, with
merged headers:
Be the first to comment