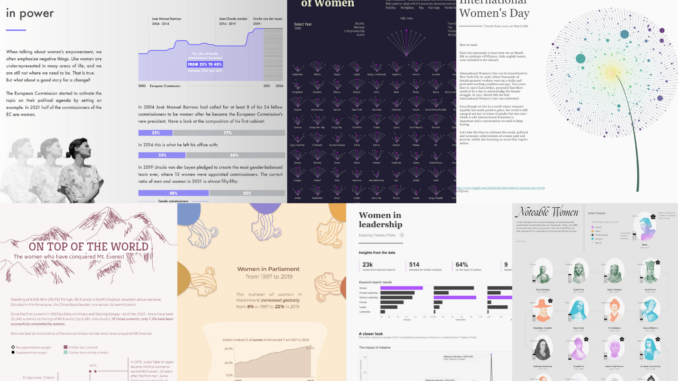
Want to go beyond just exploring vizzes about the topic? Consider joining a Tableau Community Project and vizzing alongside others. Participating is great way to recieve feedback and practice your data skills.
For example, this month’s Iron Quest theme is women. “Your viz can focus on any aspect of the theme that you wish. You might choose to viz about inspirational women in entertainment, sports, business, inspiring writers, or even notable women from history. You could also visualize social issues that impact women such as the gender pay gap, healthcare, or female representation in politics.” Get all the details and learn how to participate.
As we celebrate Women’s History Month, let us embrace the power of data visualization to tell the stories of women’s triumphs, challenges, and ongoing efforts toward equality. By harnessing the potential of visual representation, we can honor the past and advocate for a more inclusive and equitable future. Let the data speak, and let us all be inspired to contribute to a world where women’s history is not just celebrated in March but recognized and valued every day.

Be the first to comment