

The Key performance indicator (KPI) refers to a quantifiable measurement which will be used to gauge a Company’s overall long-term performance. KPIs are specifically helps determine the Company’s strategic, financial, and operational achievements.
Eg: Net Profit or Profit Margin.
In Power BI, starting from the July 2020 version, we can define and create a KPI directly in the Power BI Desktop using external tools to modify its internal Tabular model, so that it can be used in any Power BI report and also by using the Analyze in Excel feature.
The KPI feature was previously available only in Tabular models created in Analysis Services or Power BI Premium.
Scenario:
Now lets go through, how to define KPI based on Profit Margin in Power BI using the Tabular Editor.
Power BI Model:

1) Create the base Measures needed for the KPI
We primarily define the following measures in Power BI which will be further using to define the KPI in Tabular Editor
Total Sales = SUMX ( tbl_Sales, ( tbl_Sales[Unit_Price] * tbl_Sales[Units_Sold] ))
Total Cost = SUMX ( tbl_Sales,( tbl_Sales[Units_Sold] * tbl_Sales[Unit_Cost] ))
Profit Margin = [Total Sales]-[Total Cost]
Profit Margin% = DIVIDE([Profit Margin],[Total Sales],0)
PY MarginPercent =
CALCULATE (
[Profit Margin%],
SAMEPERIODLASTYEAR( ‘tbl_Calendar'[cDate] )
)
Target Margin% =
VAR vTarget = ROUND ( CALCULATE( [Profit Margin%], REMOVEFILTERS () ), 2 )
RETURN
IF([Total Sales]=BLANK(),BLANK(), vTarget)
2) Define the KPI Measures based on Profit Margin% using Tabular Editor.
First Connect our Power BI Model to the Tabular Editor
Next right-click on the Profit Margin% measure > Create New > KPI

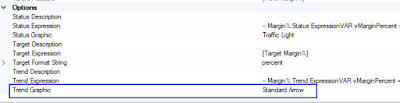
Now the Measure will be Converted to KPI, for which we need to define the Target, Status and Trend expressions as follows:

Use the measure [Target Margin%] as the Target Expression for the KPI

Margin% Status Expression:
Use the below logic for the Margin% Status Expression.
-- Margin Status Expression
VAR vMarginPercent = [Profit Margin%]
VAR vMarginTolerance = 0.035
VAR vMarginGoal = [Target Margin%] --[_Profit Margin% Goal]
RETURN
    IF (
        NOT ISBLANK ( vMarginPercent ),
        SWITCH (
            TRUE,
            vMarginPercent < vMarginGoal - vMarginTolerance, -1,  -- Negative
            vMarginPercent > vMarginGoal + vMarginTolerance, 1,   -- Positive
            0
        )
    )

The Margin% Status represents , whether the Margin% is Greater or Lesser than Margin Goal or Target.
We can choose the Status Indicator, say “Traffic Light” which displays the Green Light when the Margin% is Greater than Target, and Red Light when Margin% is Lesser than Target.

Use the below logic for the Margin% Trend Expression.
-- Margin% Trend Expression
VAR vMarginPercent = [Profit Margin%]
VAR vPrevMarginPercent =
    CALCULATE (
        [Profit Margin%],
        PREVIOUSYEAR( 'tbl_Calendar'[cDate] )
    )
RETURN
    IF (
        NOT ISBLANK ( vMarginPercent ) && NOT ISBLANK ( vPrevMarginPercent ),
        SWITCH (
            TRUE,
            vMarginPercent > vPrevMarginPercent, 1,  -- Positive
            vMarginPercent < vPrevMarginPercent, -1, -- Negative
            0
        )
    )

The Margin% Trend represents , whether the Margin% is going in Upward or Downward when compare with the same period last Year.
We can choose the Trend Graphic Indicator, say “Standard Arrow” which shows Up Trend or a Down Trend based on the Margin% vs. PY Margin%.
Finally save and deploy the changes back to the Power BI Model.
3) Use KPI Measures in Power BI to Build a Visual
When we go back and look at the Power BI, the Measure [Profit Margin%] has been converted into a KPI, with 4 default values as per below:
Value : It holds the Profit Margin% value.
Goal : It holds the Goal/Target value.
Status : It holds the Status value with Indicator.
Trend: It holds the Trend value with Indicator.

Finally, when we use them on the Matrix Visual, it looks like below:


——————————————————————————————————–
Thanks, TAMATAM ; Business Intelligence & Analytics Professional
——————————————————————————————————–
Be the first to comment