

From the Desk of Ian Culley @IanCulley
Today’s analyst meeting was one broken record after another as we ripped through the most important charts on the market.
Not a top, never hit oversold…
Not a top, never hit oversold…
There’s a raging bull market on Wall Street right now.
But the fun and games will come to a screeching halt if the following chart rolls over.
Check out the economically sensitive Home Construction ETF $ITB:
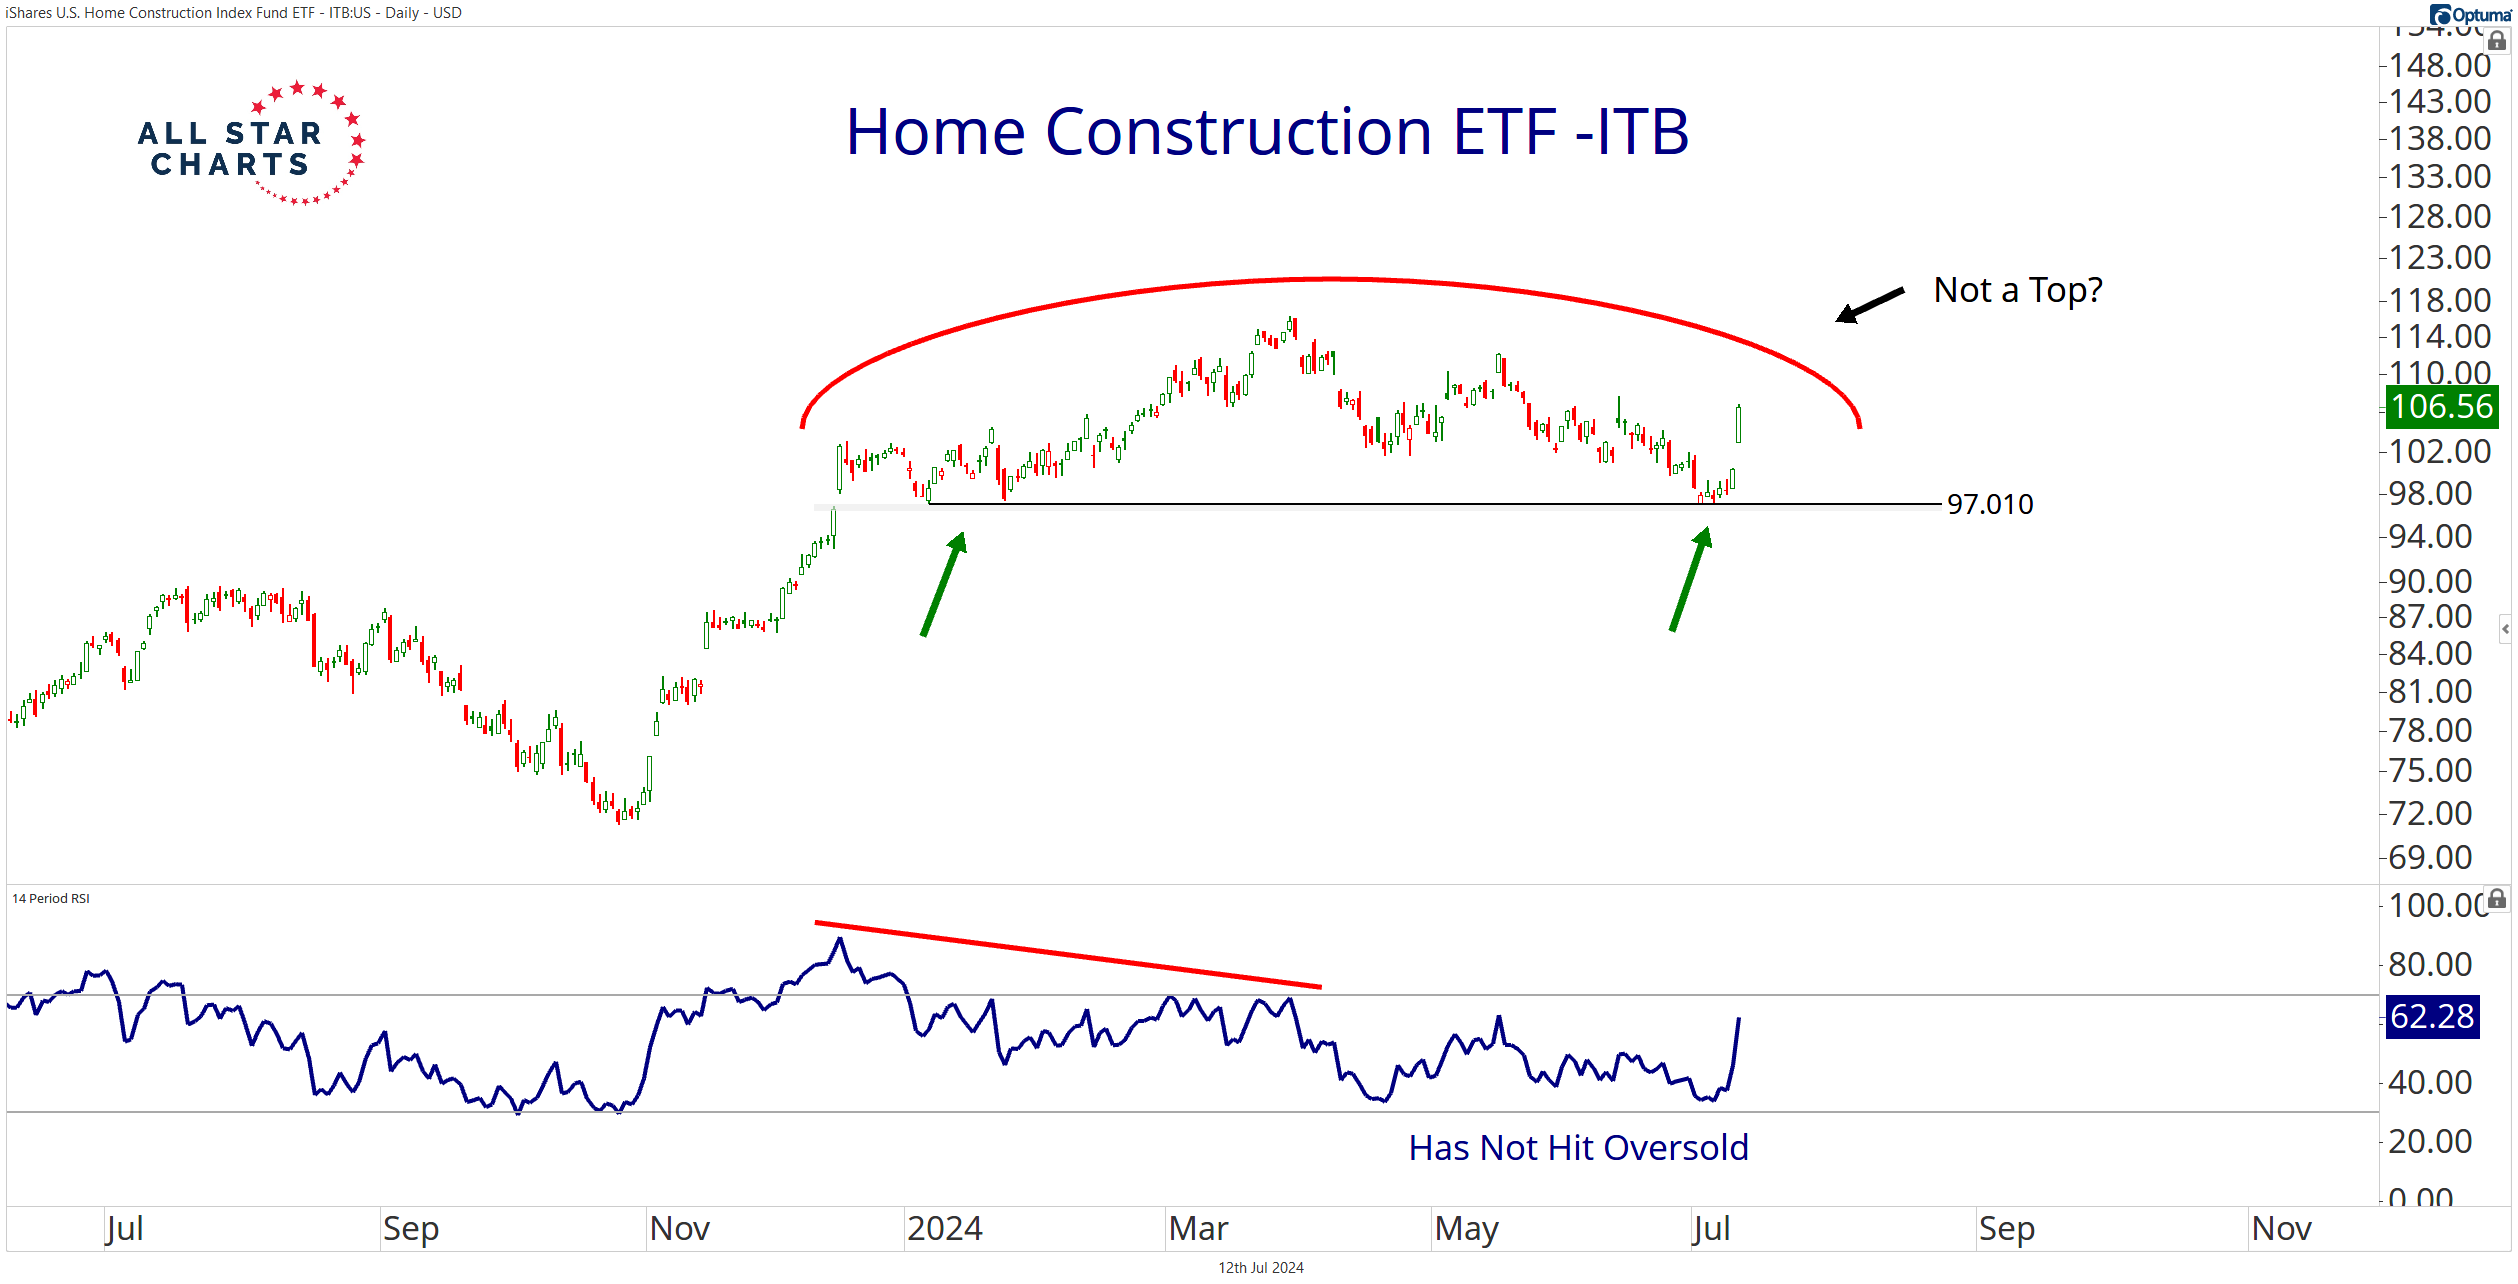
ITB checks both boxes. It never hit oversold levels and is only a top if it breaks below 97.
Plus, it’s ripping!
Of course, we need a decisive resolution above the March high of 116.34 to confirm our bullish bias.
But if the next bull run has legs, ITB will post new all-time highs.
That also means lumber futures have to stop falling.
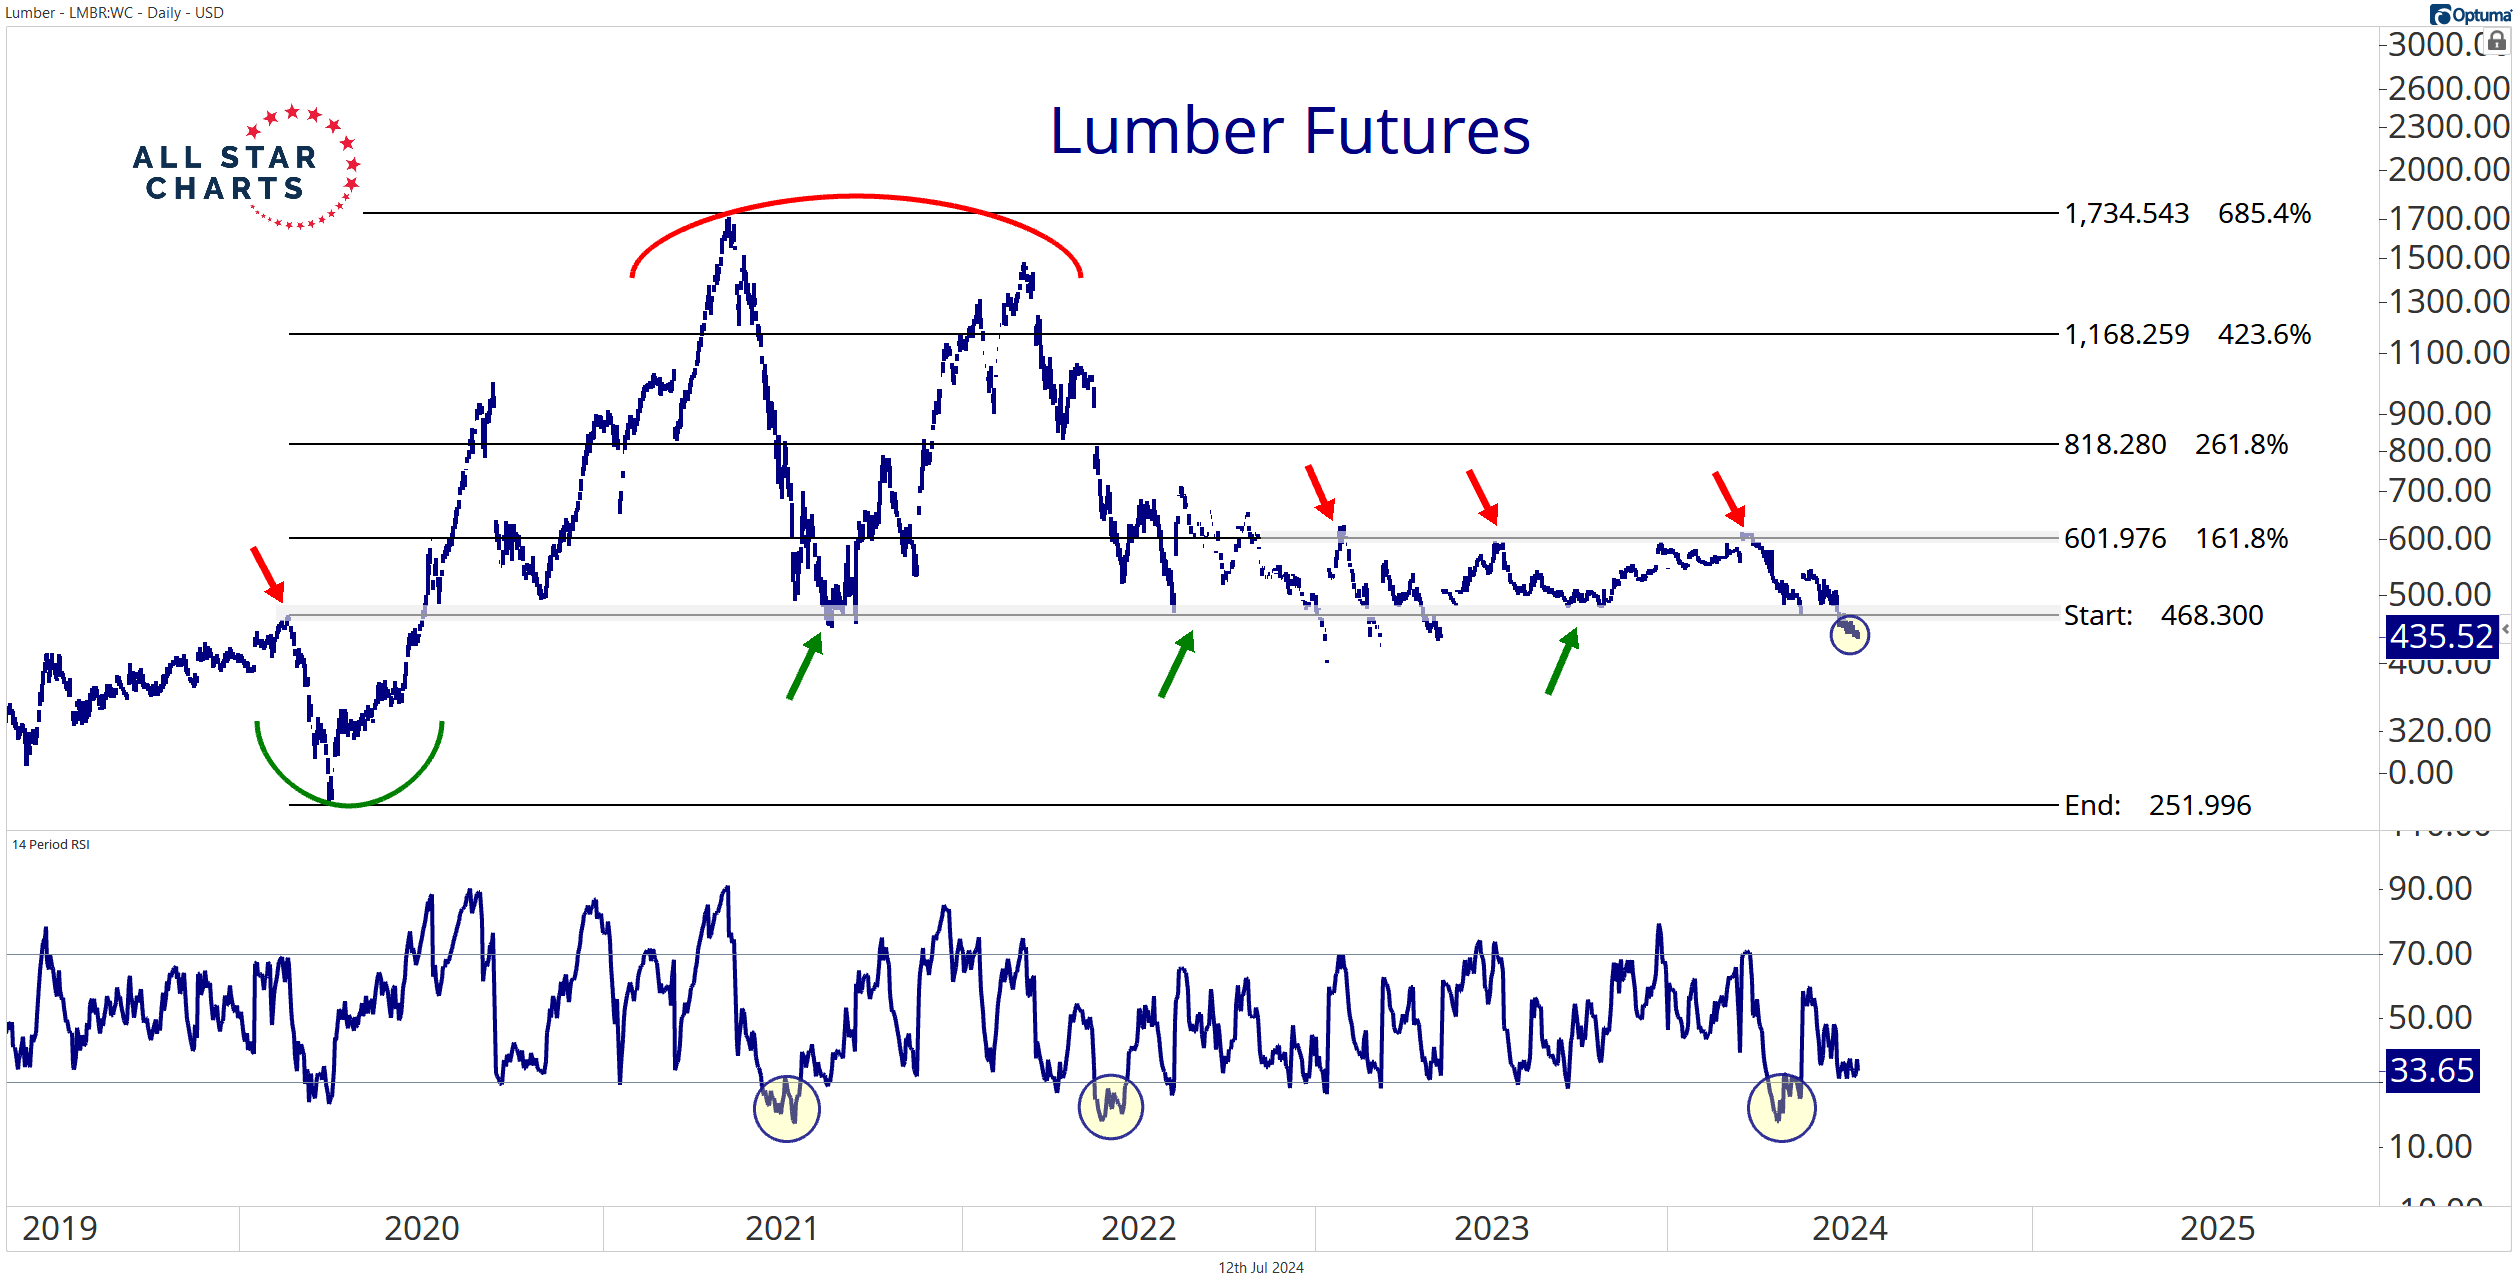
Futures have slid more than 28% beneath the March peak. If buyers are ever going to step and support higher lumber prices, this is it!
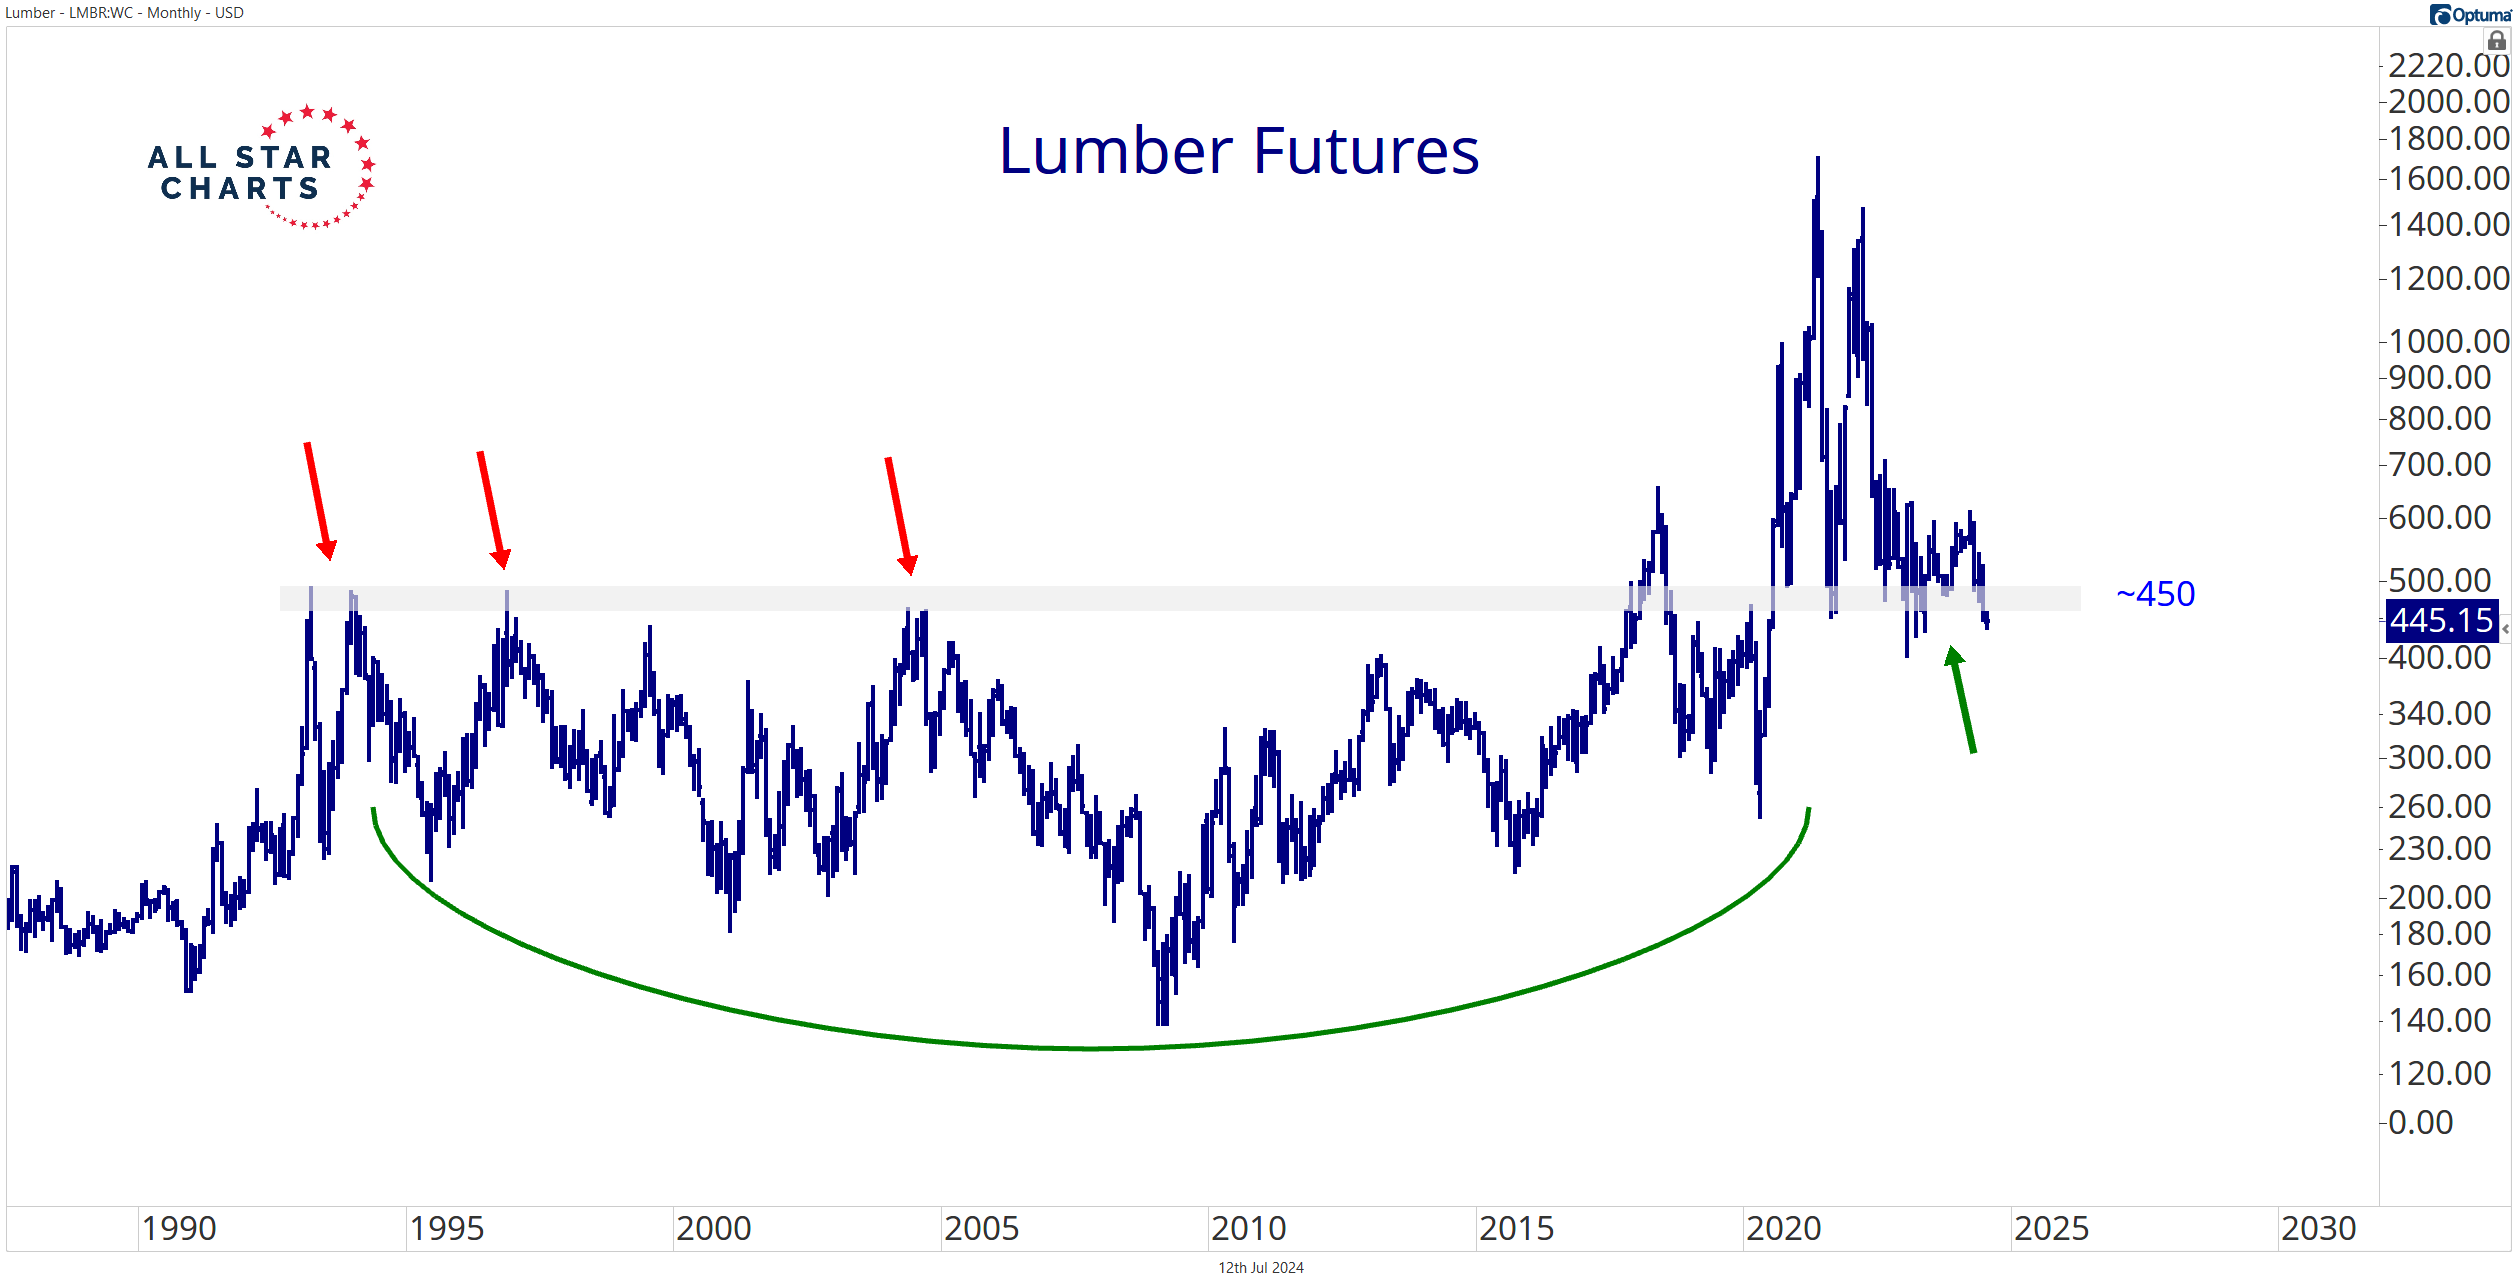
The 450 level acted as resistance for twenty-plus years but is now forming a critical support area.
Buyers have defended the lower bounds of this polarity zone in 2021, 2022, 2023, and earlier this year:
Will they do the same today?
A break above 500 would be constructive, corresponding with a downtrend line violation and a potential bullish reversal:
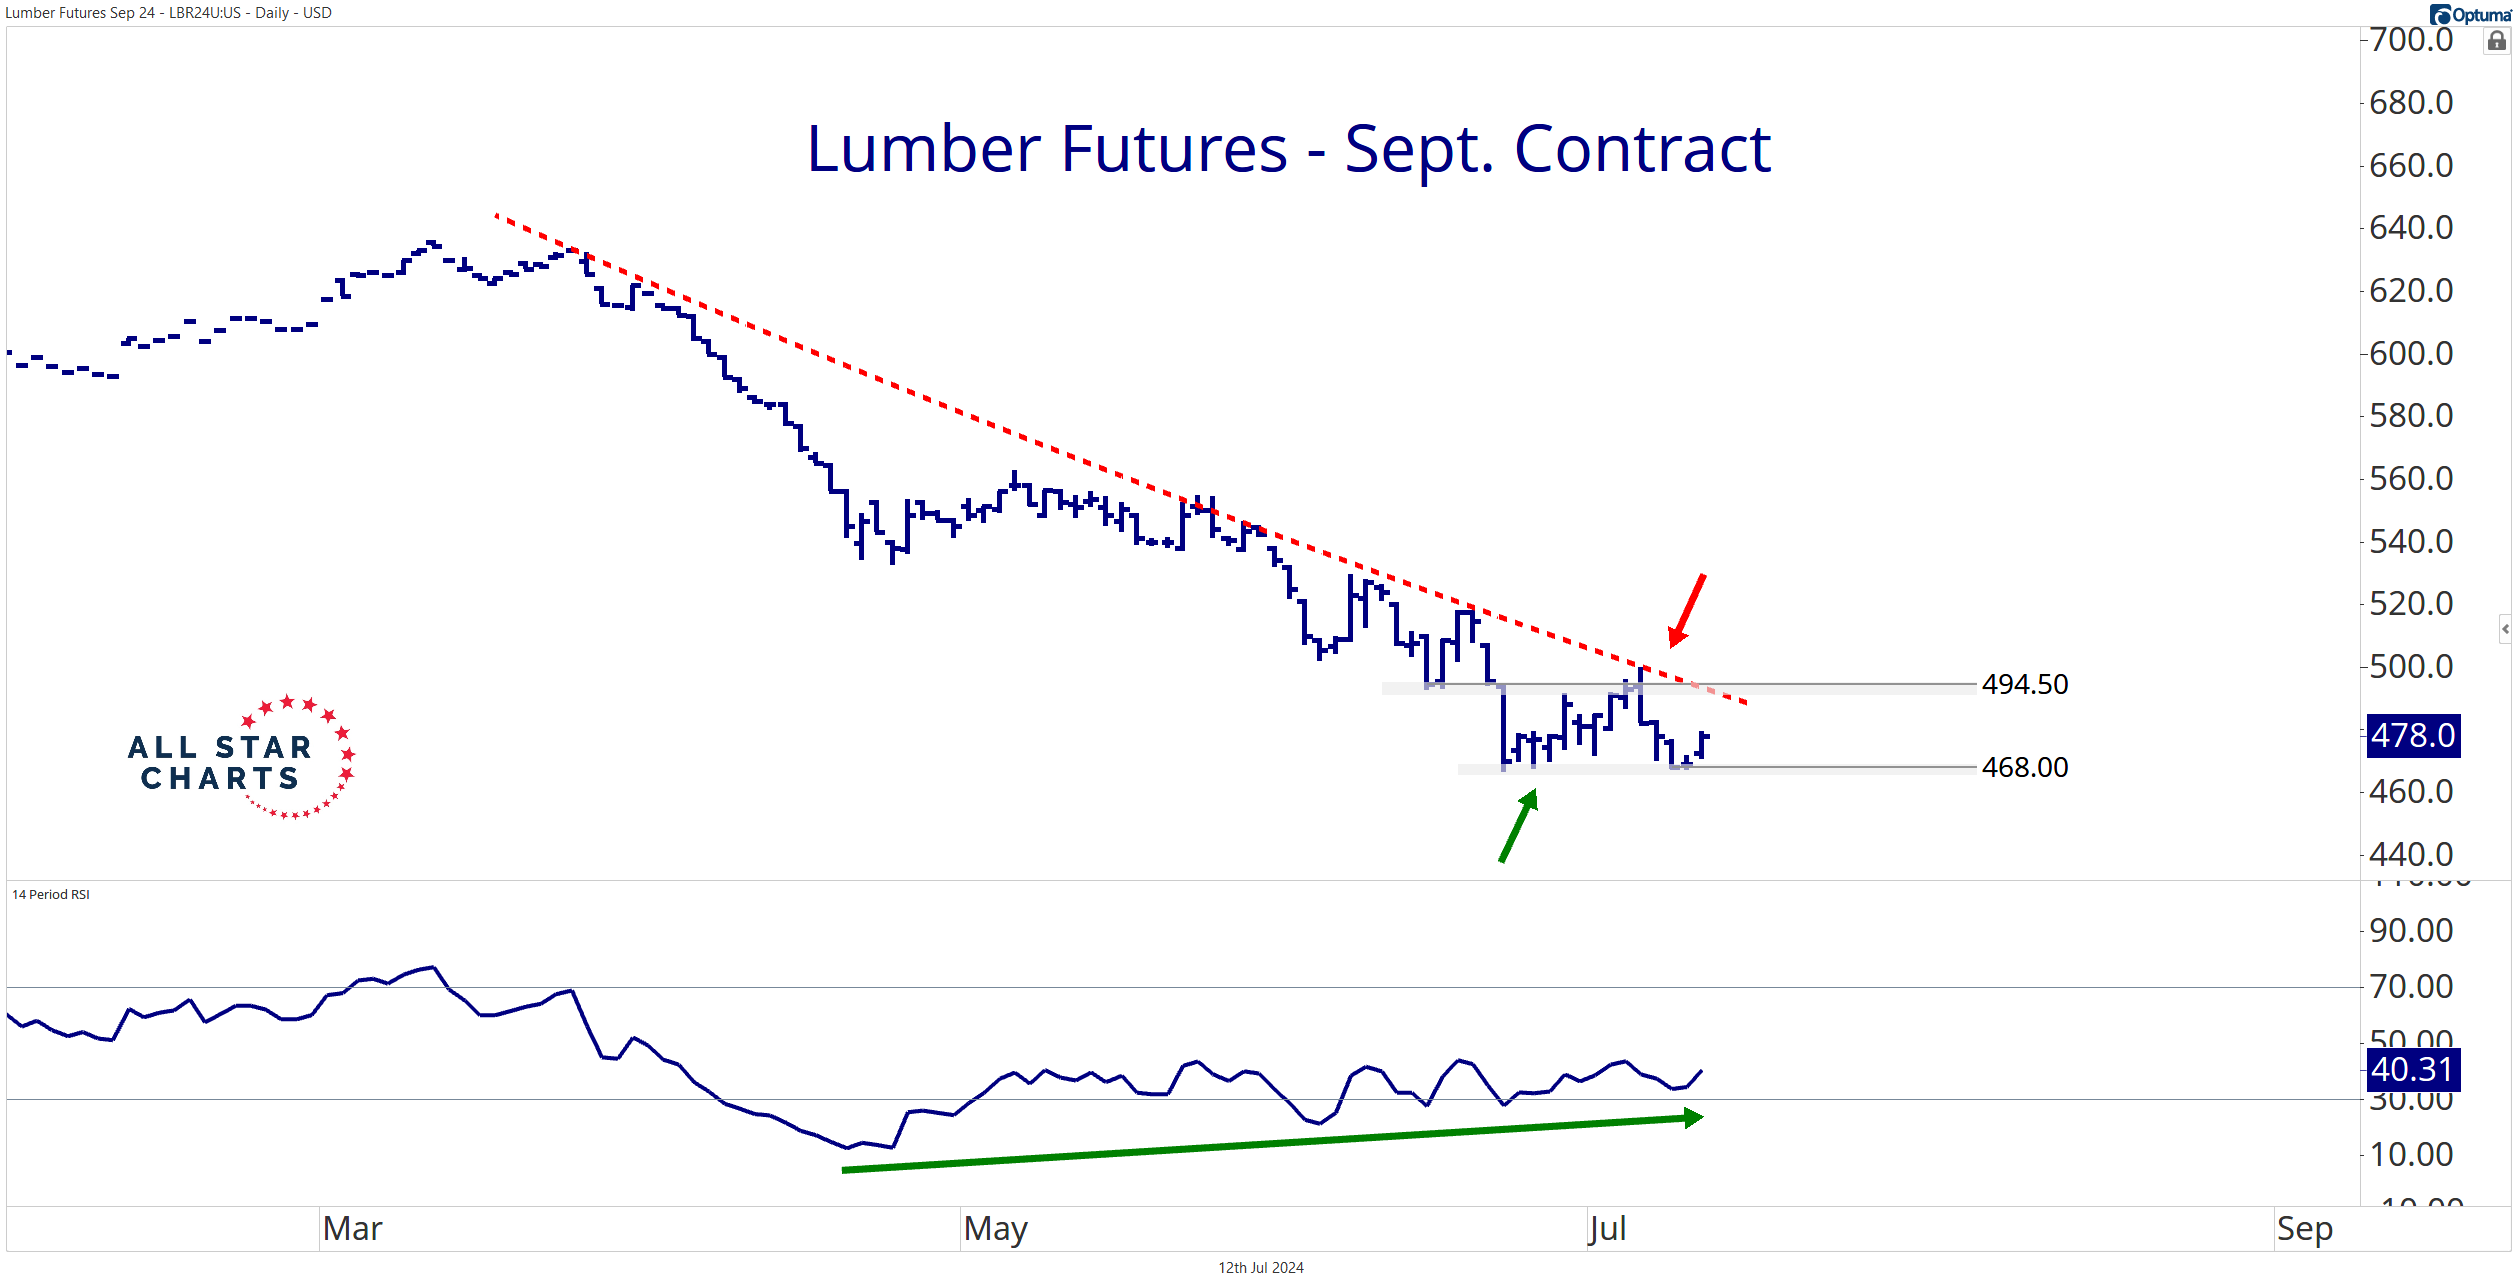
Traders: Track a September contract breakout above 494.5. A decisive close above that level sets a rough target of 600 (shelf of former highs from last year).
I’ll pass since I don’t trade lumber. (I like the bullish divergence forming on the 14-day RSI, though.)
Whether you trade the futures contract or not, a rally for lumber is a rally for homebuilders and the broader stock market.
Stay tuned for further bull market confirmation from the commodity space.
–Ian
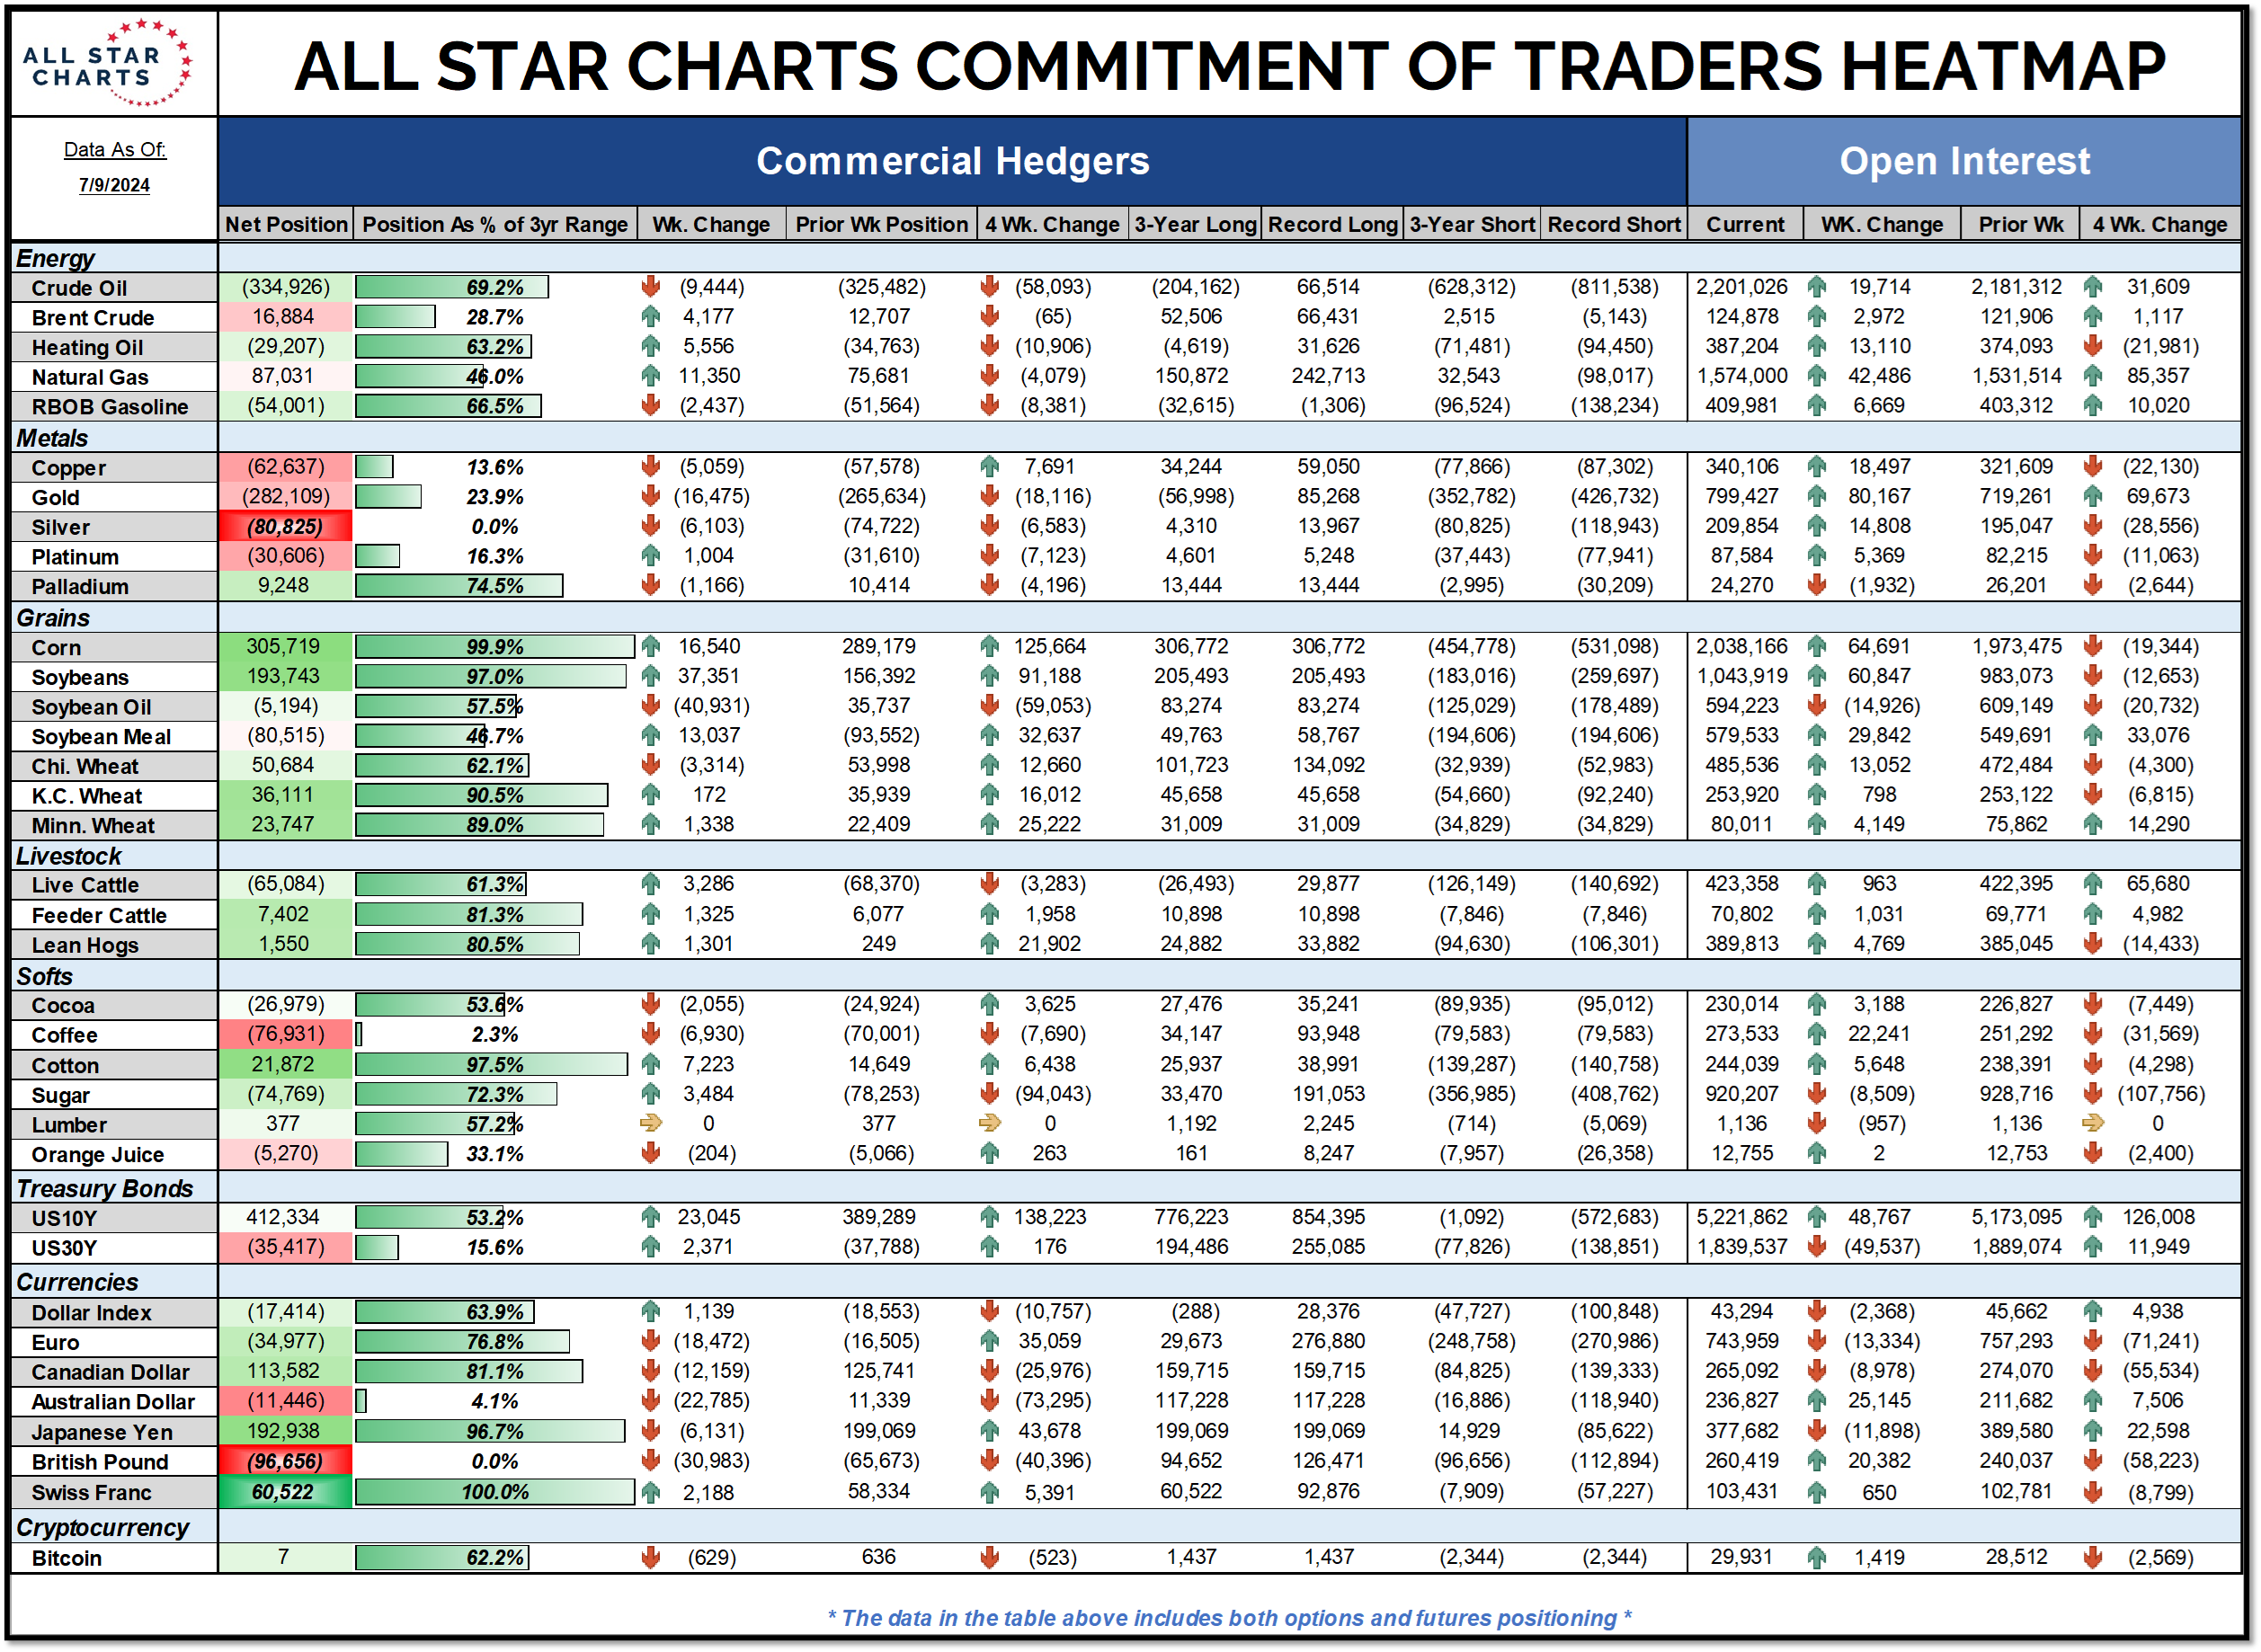
COT Heatmap Highlights
- Commercials pull within three percent of their largest short position for coffee in three years.
- Commercial net-short positioning for silver hit a new three-year extreme.
- Commercial hedgers carry their largest short position for the British pound in three years.
Click here to download the All Star Charts COT Heatmap.
Premium Members can log in to access our Weekly Commodities Report Chartbook and the Trade of the Week. Please log in or start your risk-free 30-day trial today.
Be the first to comment