

Scenario:
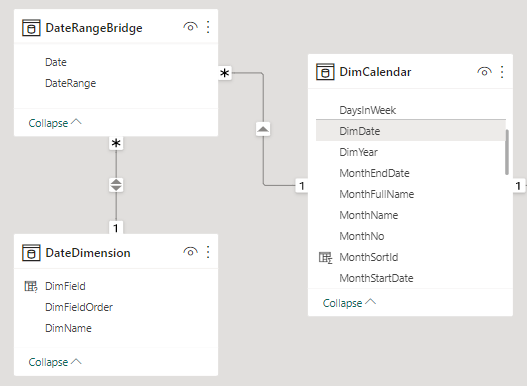
Suppose we have a Data Model as per below.

The relationships are as per below:

Requirement Criteria:
Case 1:
When user selected a Date Range of <=1 Month(say, 30 Days), then the X-Axis of the Visual should use the Date Dimension.
Case 2:
When user selected a Date Range of <=3 Months(say, 90 Days), then the X-Axis of the Visual should use the Week Dimension.
Case 3:
Case 3:
When user selected a Date Range of <=12 Months( Say , 365 Days), then X-Axis of the Visual should use the Month Dimension.
Case 4:
When user selected a Date Range of <=15 Months then X-Axis of the Visual should use the Quarter Dimension.
Case 5:
When user selected a Date Range of <=36 Months then X-Axis of the Visual should use the Year Dimension.
Note: You can define custom Date Ranges to Chose Dimension as per your requirement.
We can fulfil the above Criteria, as discussed below.
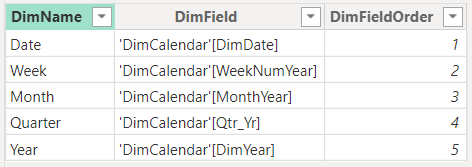
Step1: Create a Dynamic Date Dimension table using Field Parameters:
This Field Parameter table will be using for Dynamic X-Axis for the Visual.
DateDimension =
{
(“Date”, NAMEOF(‘DimCalendar’[DimDate]), 1),
(“Week”, NAMEOF(‘DimCalendar’[WeekNumYear]), 2),
(“Month”, NAMEOF(‘DimCalendar’[MonthYear]), 3),
(“Quarter”, NAMEOF(‘DimCalendar’[Qtr_Yr]), 4),
(“Year”, NAMEOF(‘DimCalendar’[DimYear]), 5)
}
Note: I have renamed Output Fields as per below:

This table will be used as a Bridge between DimCalendar and DateDimension.
DateRangeBridge =
ADDCOLUMNS(
CALENDAR(MIN(tbl_OrderDetails[Order_Date]), MAX(tbl_OrderDetails[Order_Date])),
“DateRange”,
VAR vMonthCount = DATEDIFF(MIN(tbl_OrderDetails[Order_Date]),[Date], MONTH)+1
RETURN
SWITCH(TRUE(),
vMonthCount = 1, 1, –Date
vMonthCount <= 3, 2, –Week
vMonthCount <= 12, 3, –Month
vMonthCount <= 15, 4, –Quarter
vMonthCount <= 36, 5 –Year
)
)
Step3: Enable the required relationships between DimCalendar, DateRangeBridge and Date Dimension:
The One to Many relationship between DimCalendar (1:M) DateRangeBridge with Cross Filter direction Single.
The One to Many relationship between DateDimension (1:M) DateRangeBridge with a Cross Filter direction Both.

Here I have considered a Date Slicer is based on DimCalendar[DimDate], Year Slicer is based on DimCalendar[DimYear].


Results:
Case 1:
When user selected a Date Range of <=1 Month(say, 30 Days), then the X-Axis of the Visual should use the Date Dimension.

Case 2:
When user selected a Date Range of <=3 Months(say, 90 Days), then the X-Axis of the Visual should use the Week Dimension.

Case 3:
When user selected a Date Range of <=12 Months( Say , 365 Days), then X-Axis of the Visual should use the Month Dimension.

Case 4:
When user selected a Date Range of <=15 Months then X-Axis of the Visual should use the Quarter Dimension.

Case 5:
When user selected a Date Range of <=36 Months then X-Axis of the Visual should use the Year Dimension.

——————————————————————————————————–
Thanks, TAMATAM ; Business Intelligence & Analytics Professional
——————————————————————————————————–
Be the first to comment