

I’m sure you know by now that one of the most essential components in creating visuals in Tableau is aggregation.
Aggregate functions in Tableau, such as SUM, AVG, MIN, and MAX, provide a way to perform calculations on a set of values to obtain a single, combined result.
The AGG operator in Tableau occurs by default when you add measures to your view, and the type of aggregation applied depends on the context of the view. Understanding the difference between aggregated and non-aggregated data is crucial, as it influences the way data is represented and interpreted.
Applying appropriate aggregate functions to your data can help uncover insights and create more meaningful visualizations, allowing for better-informed decision-making.

In this article, we will explore the various aggregation calculations available in Tableau Desktop, discuss their applications, and demonstrate how to correctly create an aggregate calculation.
Our goal is to help you grasp the concept of aggregation in Tableau and enable you to effectively utilize this feature to enhance your data analysis and visualization capabilities.
Let’s jump into it.
Understanding Aggregates in Tableau
Tableau aggregate expressions are crucial in managing and analyzing large datasets.
Aggregate functions help in summarizing and changing the granularity of data. Tableau, by default, applies aggregation to measures when added to the view. The type of aggregation applied depends on the context of the view.
For example, statistical function like Sum, Average, Minimum, Maximum, and Count are some common aggregate functions used in Tableau.
These functions enable users to analyze complex data by consolidating values into simpler formats, allowing for better understanding and comparisons.
In some cases, it’s crucial to distinguish between “SUM(Measure)” and “AGG(Measure)” in Tableau.
The distinction is straightforward – when you directly drag the original data source field to the visualization, Tableau usually applies the default aggregation (often SUM) to the measure, unless you’ve modified the default settings. This is when “SUM” in front of the measure is visible.
On the other hand, if you create a custom calculation that includes an aggregate function, such as “AVG,” “MIN,” or “MAX,” and then add this calculated field to the visualization, an “AGG” indicator will be displayed.
This indicator signals that a custom aggregation has been applied to the column, different from the default aggregation used when directly dragging the original data source field.
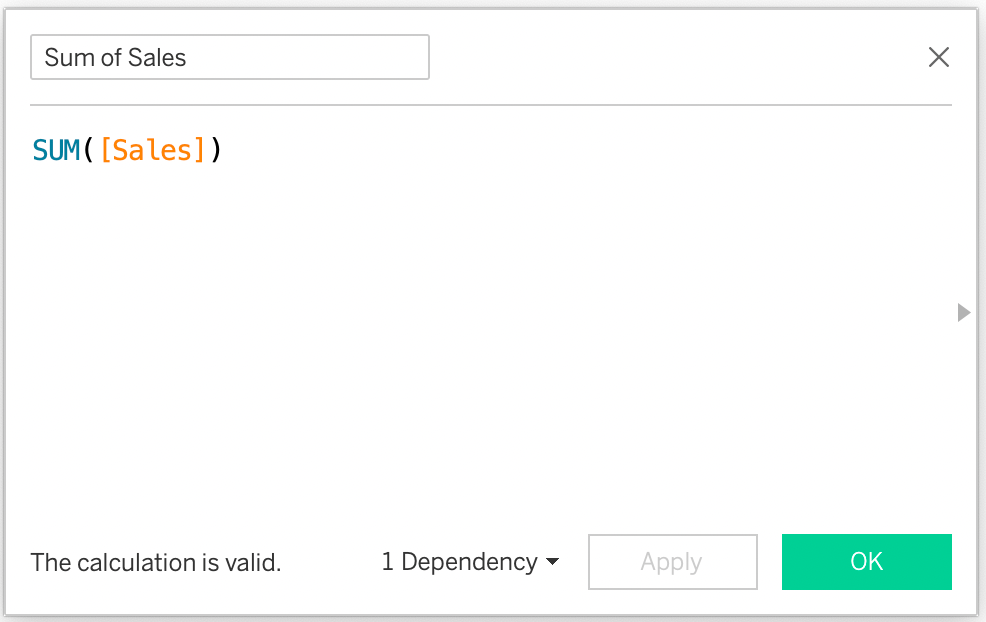
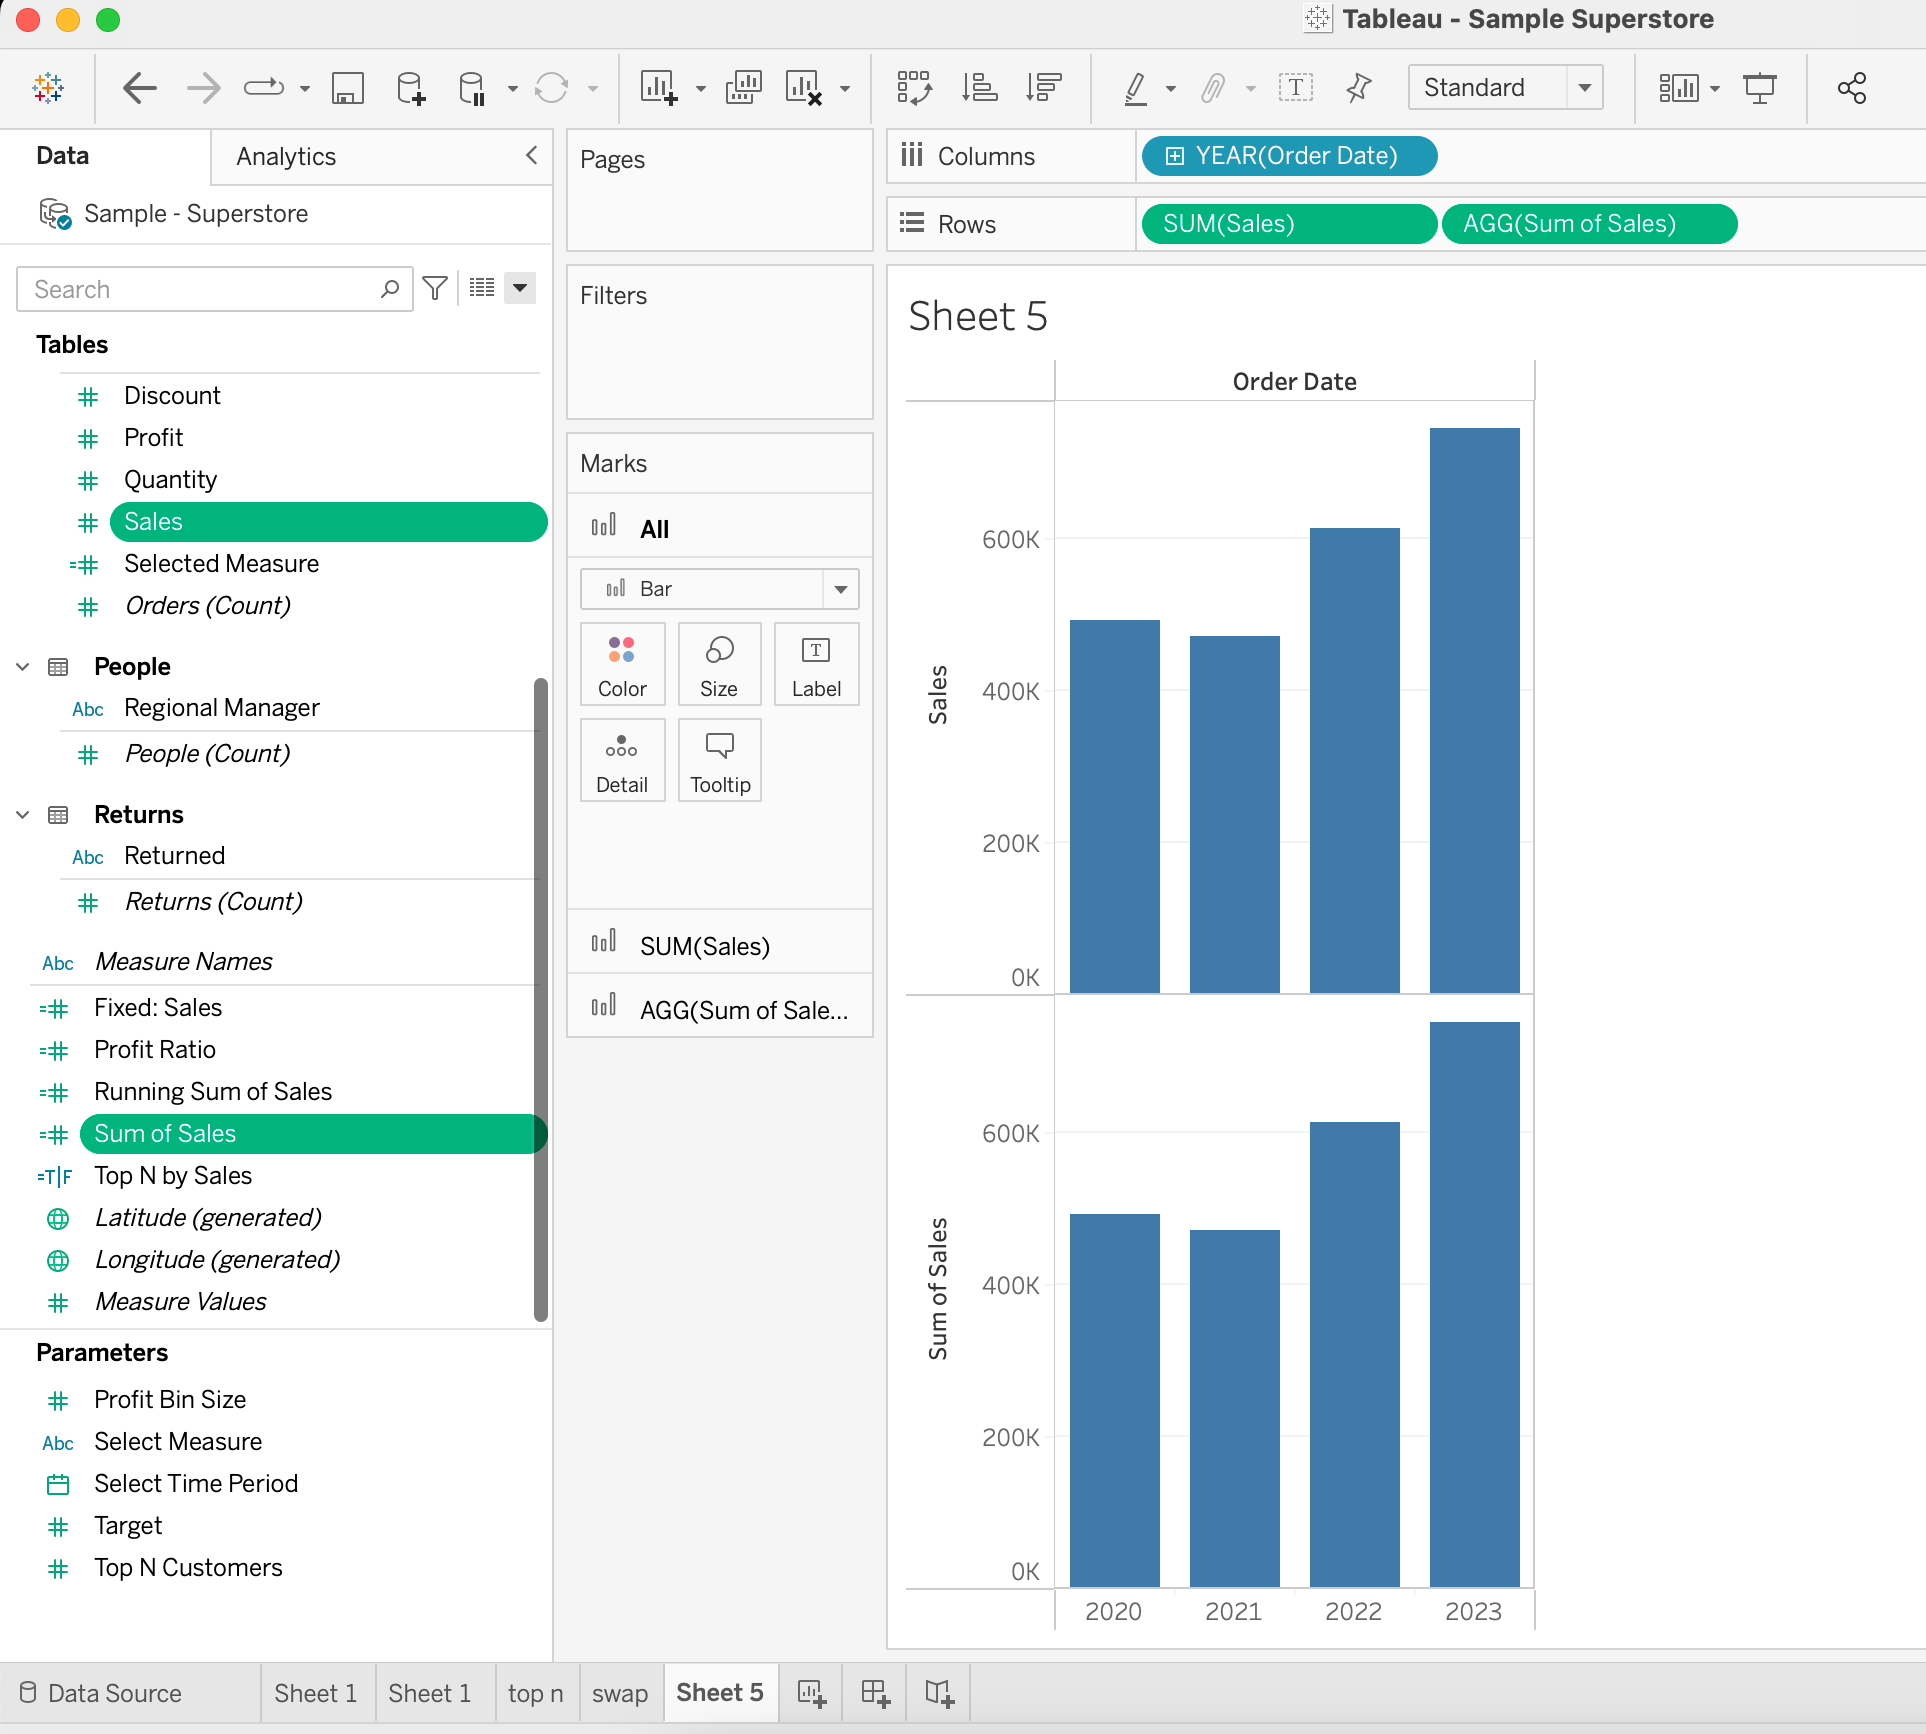
Now, let’s compare how the pills look after dragging the original “Sales” column and the newly created “Sum of Sales” field to the visualization.
In the rows shelf, there are two variables – the first one has a SUM aggregation applied as a result of default properties, denoted by the “SUM” label, while the second one indicates a custom aggregation applied by the user.
The custom aggregation is displayed in the pill to inform users about the specific calculation being used for that field in the visualization.
You’ll find, this distinction is important as it helps users —> you understand how the data is being summarized in the given expression and what calculations are being performed to generate the visual representation.
Using calculated fields and aggregate functions in Tableau offers a powerful and efficient way to analyze data.
By understanding aggregation concepts, you can harness the full potential of Tableau’s data analysis capabilities and make informed decisions based on the insights derived from complex data sets.
Are you interested in exploring the full potential of Tableau? Check out our comprehensive article on “What is Tableau?” to discover all the amazing possibilities and features this powerful data visualization tool has to offer.
Now, let’s dive into some practical examples!
Fundamentals of Aggregates
Functions and Data Types
Aggregates in Tableau are used to summarize or alter the granularity of your data. They can be applied to both measures and dimensions, though they are more commonly used with measures. When you add a measure to your view in Tableau, an aggregation is automatically applied to that measure by default.
Some of the common aggregate functions used in Tableau are:
- SUM: Adds up all the values in a group.
- AVG: Calculates the average value of a group.
- MAX: Determines the highest value in a group.
- MIN: Discovers the lowest value in a group.
- COUNT: Counts the number of non-null values in a group.
- STDEV: Calculates statistical standard deviation of the entire population.
- VAR: Calculates statistical variance of the sample population.
Here you can find full list of available aggregation functions.
Using Aggregate Functions in Calculated Fields
In Tableau, calculated fields allow you to create new data based on existing data in your data source. This is done by defining a formula which transforms the existing data into the desired new data format. To create a calculated field, follow these steps:
- Navigate to a data pane and select Down Arrow > Create Calculated Field.
- In the calculation editor, provide a Name for the calculated field.
- Enter the desired Formula using the available fields and functions.
Aggregations play an essential role in Tableau. You can include aggregate functions in custom formulas to better manipulate the data by grouping or summarizing it. Here’s an example using the SUM operator:
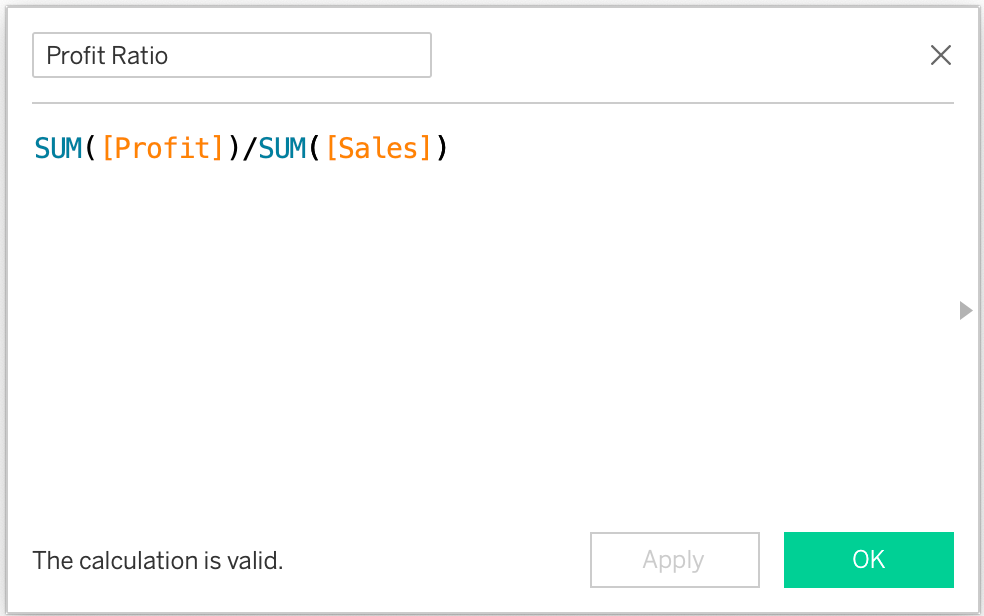
This formula calculates the gross margin. Note that in this case, the SUM() function is applied within the calculated field. Tableau also has other aggregate functions, such as COUNT, AVG, MIN, and MAX.
Aggregate Functions in Level of Detail Expressions
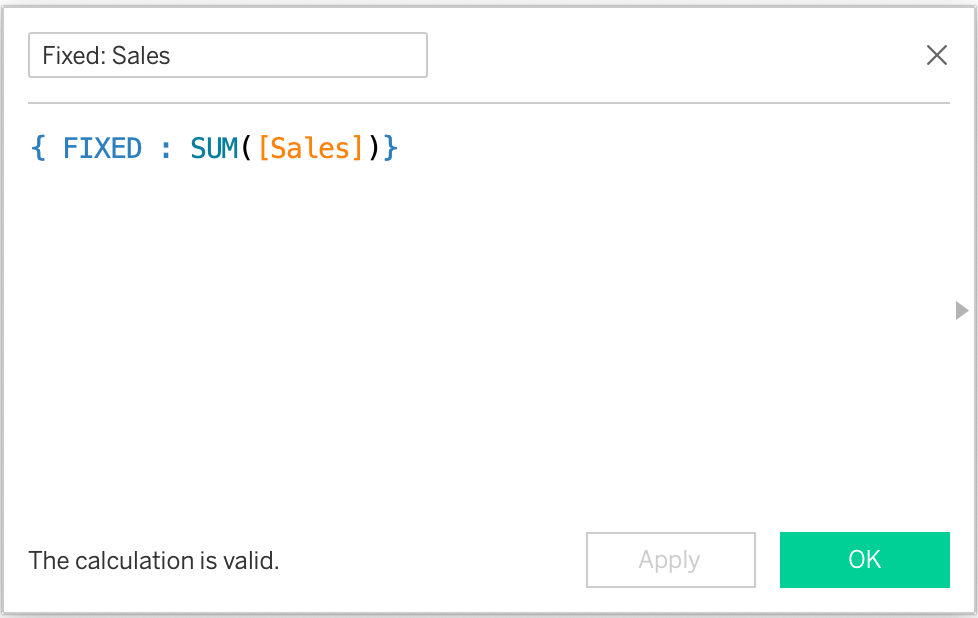
Level of Detail expressions, or LOD expressions, are essential components of Tableau, giving control over the granularity of the computations they want to perform. There are three types of LOD expressions (Fixed, Include, Exclude) and all of them use the following syntax:
{FIXED [Dimension1, Dimension2,...] : AGGREGATE_FUNCTION (Expression)}As you can see, aggregate measures are obligatory element of LOD expression.
Aggregate Functions in Table Calculations
Table calculations in Tableau are powerful tools that enable you to perform calculations on the data within multiple rows in a table based on their position in the table, providing deep insights into your data.
Table calculations are different from other types of calculations in Tableau because they operate on the data within the view and depend on its layout.
They can be used for various purposes, such as calculating percentages of total, computing running totals, or customizing table structure.
To use an aggregate function in a table calculation, you can employ them within your table calculation expression.
For instance, if you want to calculate the percentage of total sales for individual rows in your table.
Also, you can create an expression based a table calculation using the TOTAL() function applied to the aggregated values of Sales.
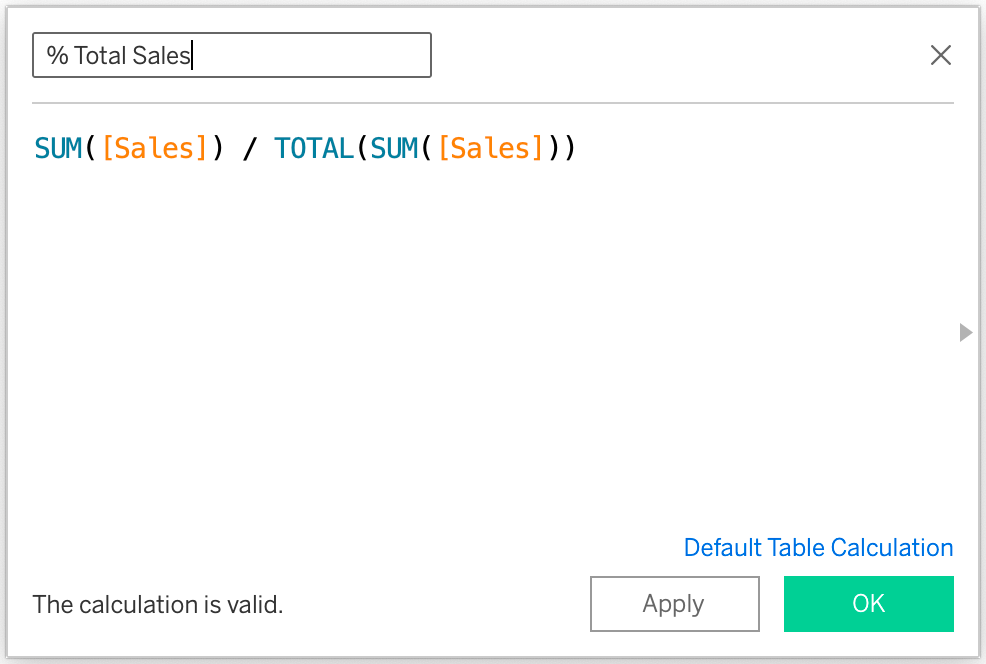
This expression divides the given function, which is the sum of the sales for the distinct items of each item by the total sales in the table, providing the percentage of total sales for each item.
In conclusion, table calculations in Tableau are versatile and essential tools for data analysis.
By understanding how these calculations work and utilizing the available table calculation functions, you can perform complex aggregations and better comprehend your data.
Next, we’ll explore the rules and good practices of how to use Tableau aggregate expressions.
Practical Hints How to Utilize Aggregation functions
Tableau’s AGG operator is a powerful tool for performing aggregate calculations in data visualizations. However, there are some essential rules that need to be followed when using this operator.
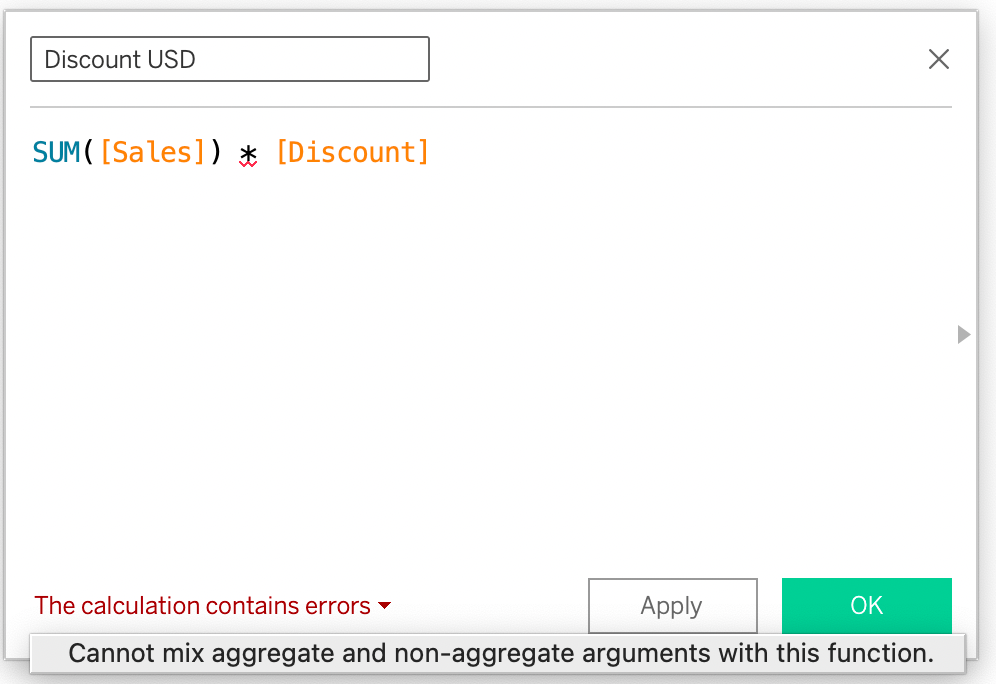
- Firstly, you cannot combine an aggregated values with a disaggregated values in the same expression. For example, SUM([Sales]) * [Discount] is not valid since SUM(Price) is aggregated while Items is not.
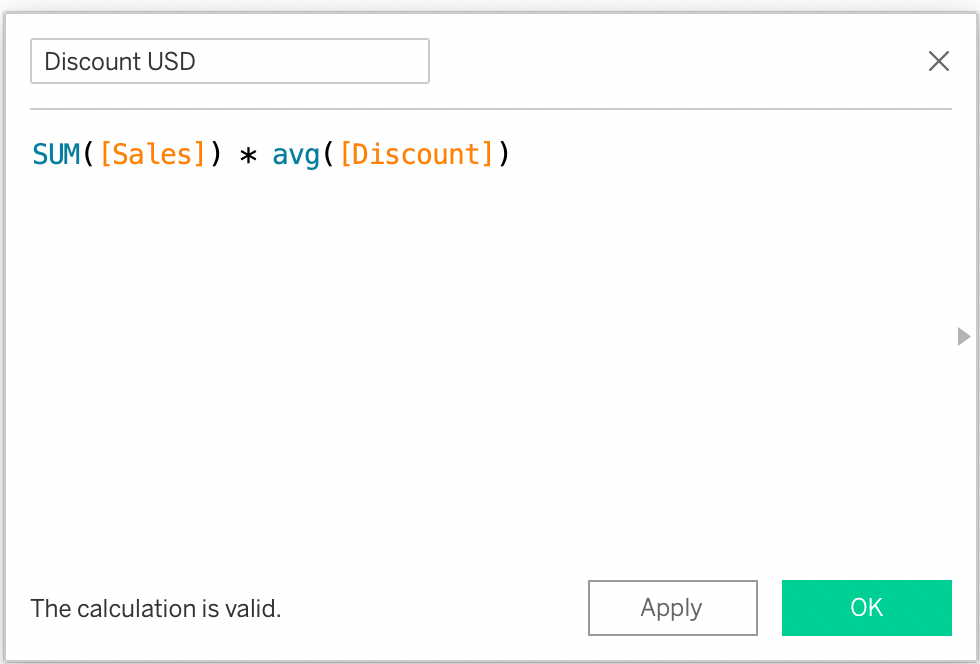
 Instead, you can use valid expressions like SUM([Sales]) * avg([Discount]).
- To better understand how aggregation functions perform, consider the length of the output. The data source field, such as Sales, contains multiple elements, equal to the length of the data source.
On the other hand, the output of the aggregation function, like SUM(Sales), returns only one value. This single value represents the result of the aggregation calculation applied to all the elements in the Sales field.
Aggregation functions condense the data into a single value, allowing for more concise and meaningful analysis of large datasets.
By grasping this concept, data analysts can effectively leverage aggregation functions in Tableau to extract valuable insights from their data and create informative visualizations.
- It’s important to note that the result of an aggregate calculation is always a measure.
By adhering to these rules, users can confidently utilize the AGG operator in Tableau to perform accurate and insightful aggregate calculations, enhancing their data visualization and analysis process.
Do you want to explore real-life examples of how to utilize Tableau functionalities? Take a look at our article on “Tableau Case Statement: How to Evaluate a Single Expression” to learn more about practical applications and techniques in Tableau.
Final Thoughts
AGG in Tableau plays a pivotal role in data visualization and analysis, allowing users to summarize and transform large datasets into meaningful insights.
Understanding the difference between aggregated and non-aggregated data is essential for accurate interpretations.
Also, by utilizing aggregate functions in calculated fields, level of detail expressions, and table calculations, analysts can gain deeper insights into their data.
The versatility of aggregate functions enables users to perform complex calculations and tailor visualizations to their specific needs. Adhering to the rules of AGG operator ensures accurate and insightful data analysis.
Overall, mastering the art of aggregation empowers users to create dynamic and interactive visualizations of data sources, enabling better-informed decision-making and a deeper understanding of data trends and patterns in Tableau.
Let’s compare how aggregate measures function in different BI tools. Read the article “Simple Aggregations In Power BI” to gain insights into how Power BI handles basic aggregation operations.
Frequently Asked Questions
How to aggregate string diemnsion in Tableau?
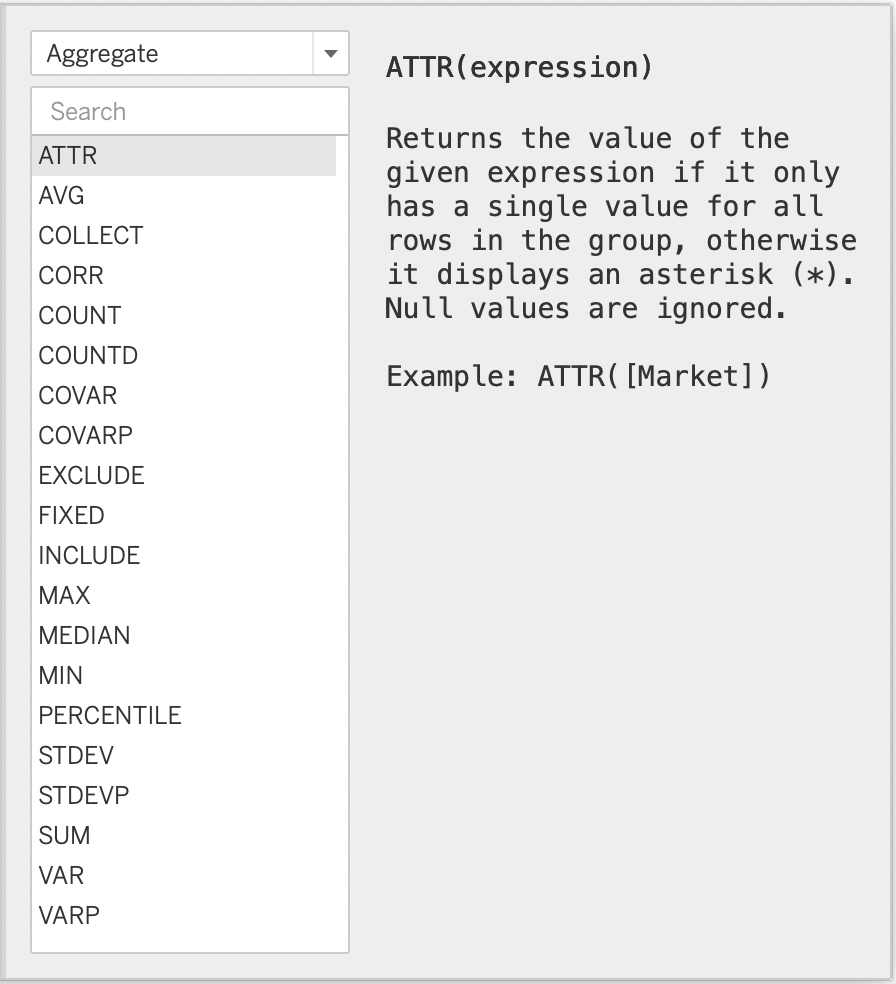
In Tableau, string dimensions cannot be directly aggregated like numerical values. However, you can use the Attribute (ATTR) function to aggregate string columns.
The ATTR function returns a unique value if there is only one value for the specified field in the view. If there are multiple values, it returns an asterisk (*) indicating that there are multiple values.
Another popular expression you can apply to the string value is COUNTD function.
Why can’t I mix aggregate and non-aggregate in Tableau?
Tableau does not support mixing aggregate and non-aggregate functions directly in a single calculation. This is because aggregate functions summarize data at a higher level, while non-aggregate functions process data at a lower level of detail.
AGG vs AVG: What’s the difference in Tableau?
AGG (Aggregate) is a general term for calculations that summarize data in Tableau by statistical function, such as SUM, COUNT, MIN, MAX, and AVG. AVG (Average) is a specific aggregation function that calculates the mean value of a numerical measure.
The difference between AGG and AVG is that AGG refers to any aggregation function, while AVG represents the specific function used to calculate the mean value of a measure.
Why is Tableau showing AGG instead of SUM?
Tableau shows “AGG” instead of “SUM” when you create a custom calculation that contains an aggregate function, such as “SUM,” and then add this calculated field to the visualization.
The “AGG” indicator is displayed to inform users that a custom aggregation has been applied to the column, different from the default aggregation used when directly dragging the original data source field.
Be the first to comment