In this blog post I am going to show you an easy way to clean your data (which is often fixing data issues or mis-spelt data) using the new feature Launch Data Wranger using DataFrames
I had previously blogged about using Pandas data frames but this required extra steps and details, if you are interested in that blog post you can find it here: Did you know that there is an easy way to shape your data in Fabric Notebooks using Data Wrangler?
In this blog post I am going to show you how I cleaned up the data in my location column.
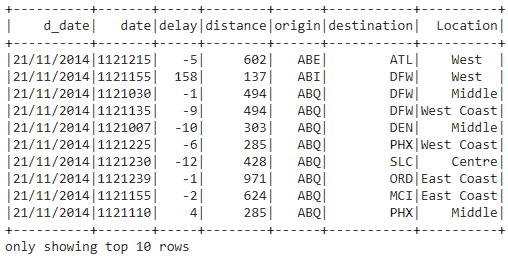
The first step I did was to load the CSV into a data frame in my PySpark notebook as shown below.
df_staging = spark.read.format(“csv”).option(“header”,“true”).load(“Files/Delay_Data/*.csv”)
# View the df_staging is bringing back data.
df_staging.show(10)
Once I had run this I could then see the output of the data from my CSV files.

Next, to transform my data, I need to get my data frame into the Data Wrangler with the steps below.
- I clicked on Data.
- Then I clicked on “Transform DataFrame in Data Wrangler”
- Finally, I select the name of my data frame “df_staging”

In the steps below is where I now transformed my data for the Location column.
I expanded Operations and then selected “Find and replace”

I then completed the following steps below to complete the find and replace.
- I clicked on the drop down and selected the column called “Location”
-
For the Old value, is the value I am searching for to replace.
- In my example I am looking for “Coast”
- I wanted to replace the value with nothing, so I pressed the space bar once.
- Once I was happy with the results I clicked on Apply.

I could then see the changes in the green column before I applied them.

I then clicked Apply (Number 4 from above).
If I wanted to see the code, I could see this in the section as shown below which is writing the code for me.

Then applied by clicking on “Add code to notebook” as shown below.

I could then see the code in the notebook as shown below.

The final step was to take my transformed data which I inserted into my Lakehouse table as shown below.

I could then go into my Lakehouse and view the “Delays” table using the SQL Endpoint.

I hope that you found this useful and that you now can easily transform your data in Fabric using the Notebooks and data wranglers.
Any comments or suggestions are most welcome!

Be the first to comment