

From the Desk of Ian Culley @IanCulley
I need to set the record straight.
Earlier in spring, I wrote a note highlighting wheat’s tendency to lead crude oil at key inflection points.
While this statement is mostly true, it needs clarification.
Chicago wheat does have a tendency to lead crude oil at significant market tops. But crude leads at critical troughs.
Check out the crude oil overlaid with Chicago wheat futures:
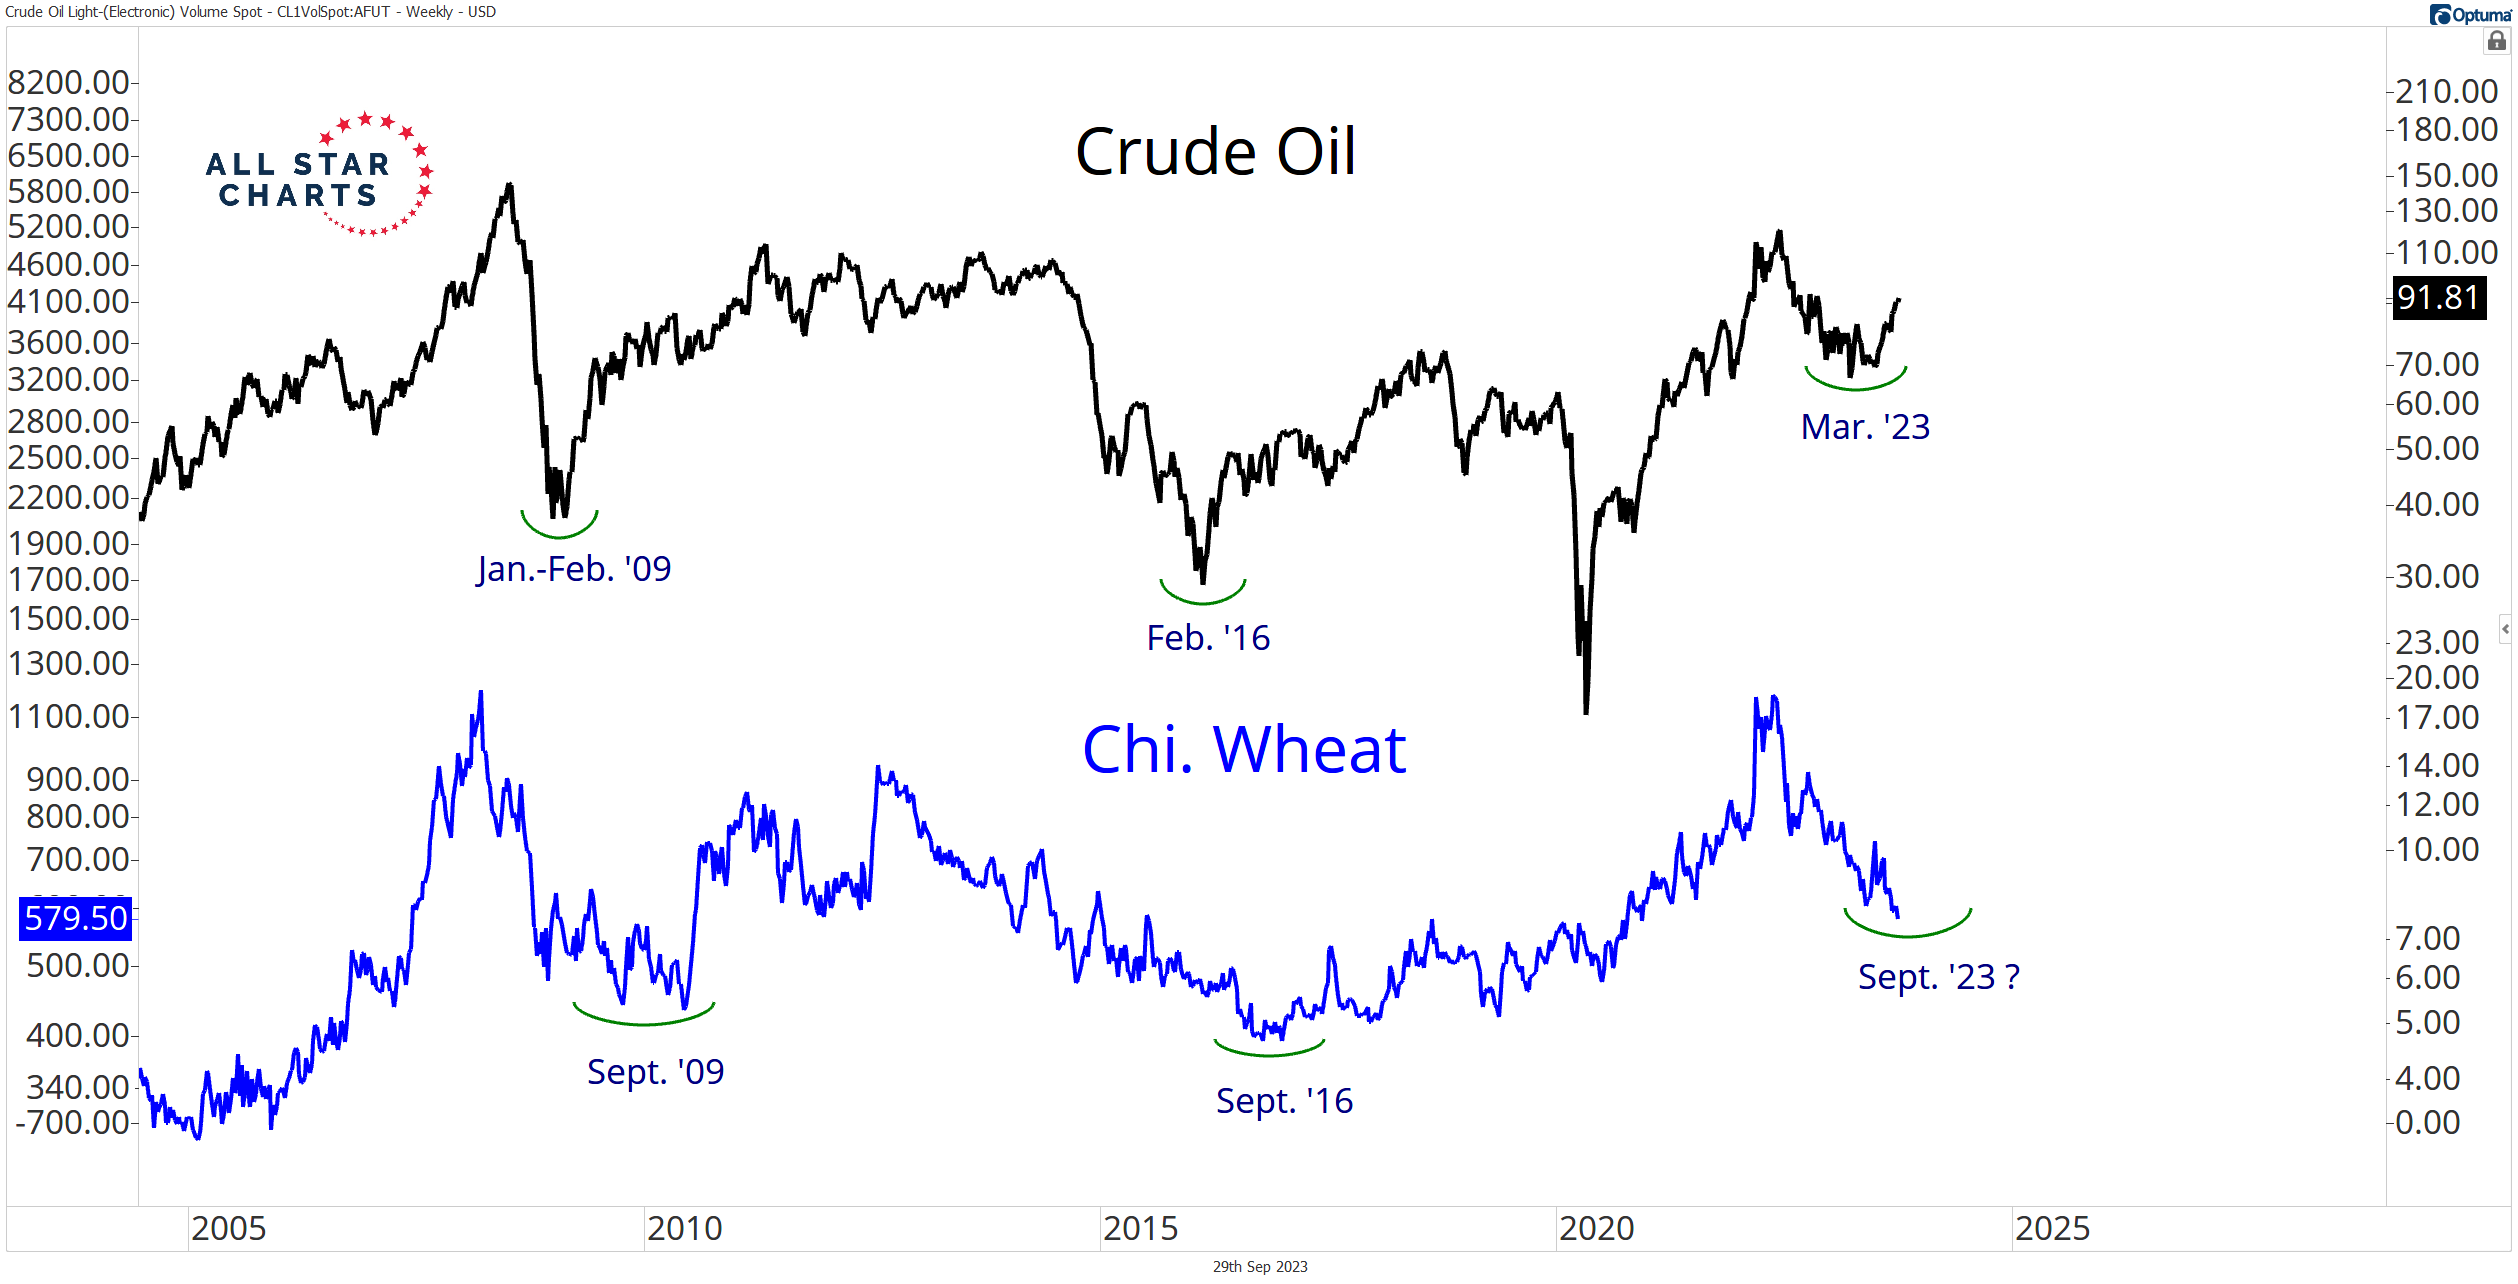
Notice crude bottomed in Q1 of 2009, 2016, and earlier this year. Chicago wheat followed roughly six to nine months later, marking critical turning points in late Q3 of 2009 and 2016.
Will wheat do the same in 2023?
I don’t know. But strong seasonal trends are clearly at work in both markets.
And if crude oil’s rally provides any indication, I have to lean toward “yes.”
Here are crude oil futures breaking out of a multi-month base, posting new year-to-date highs:
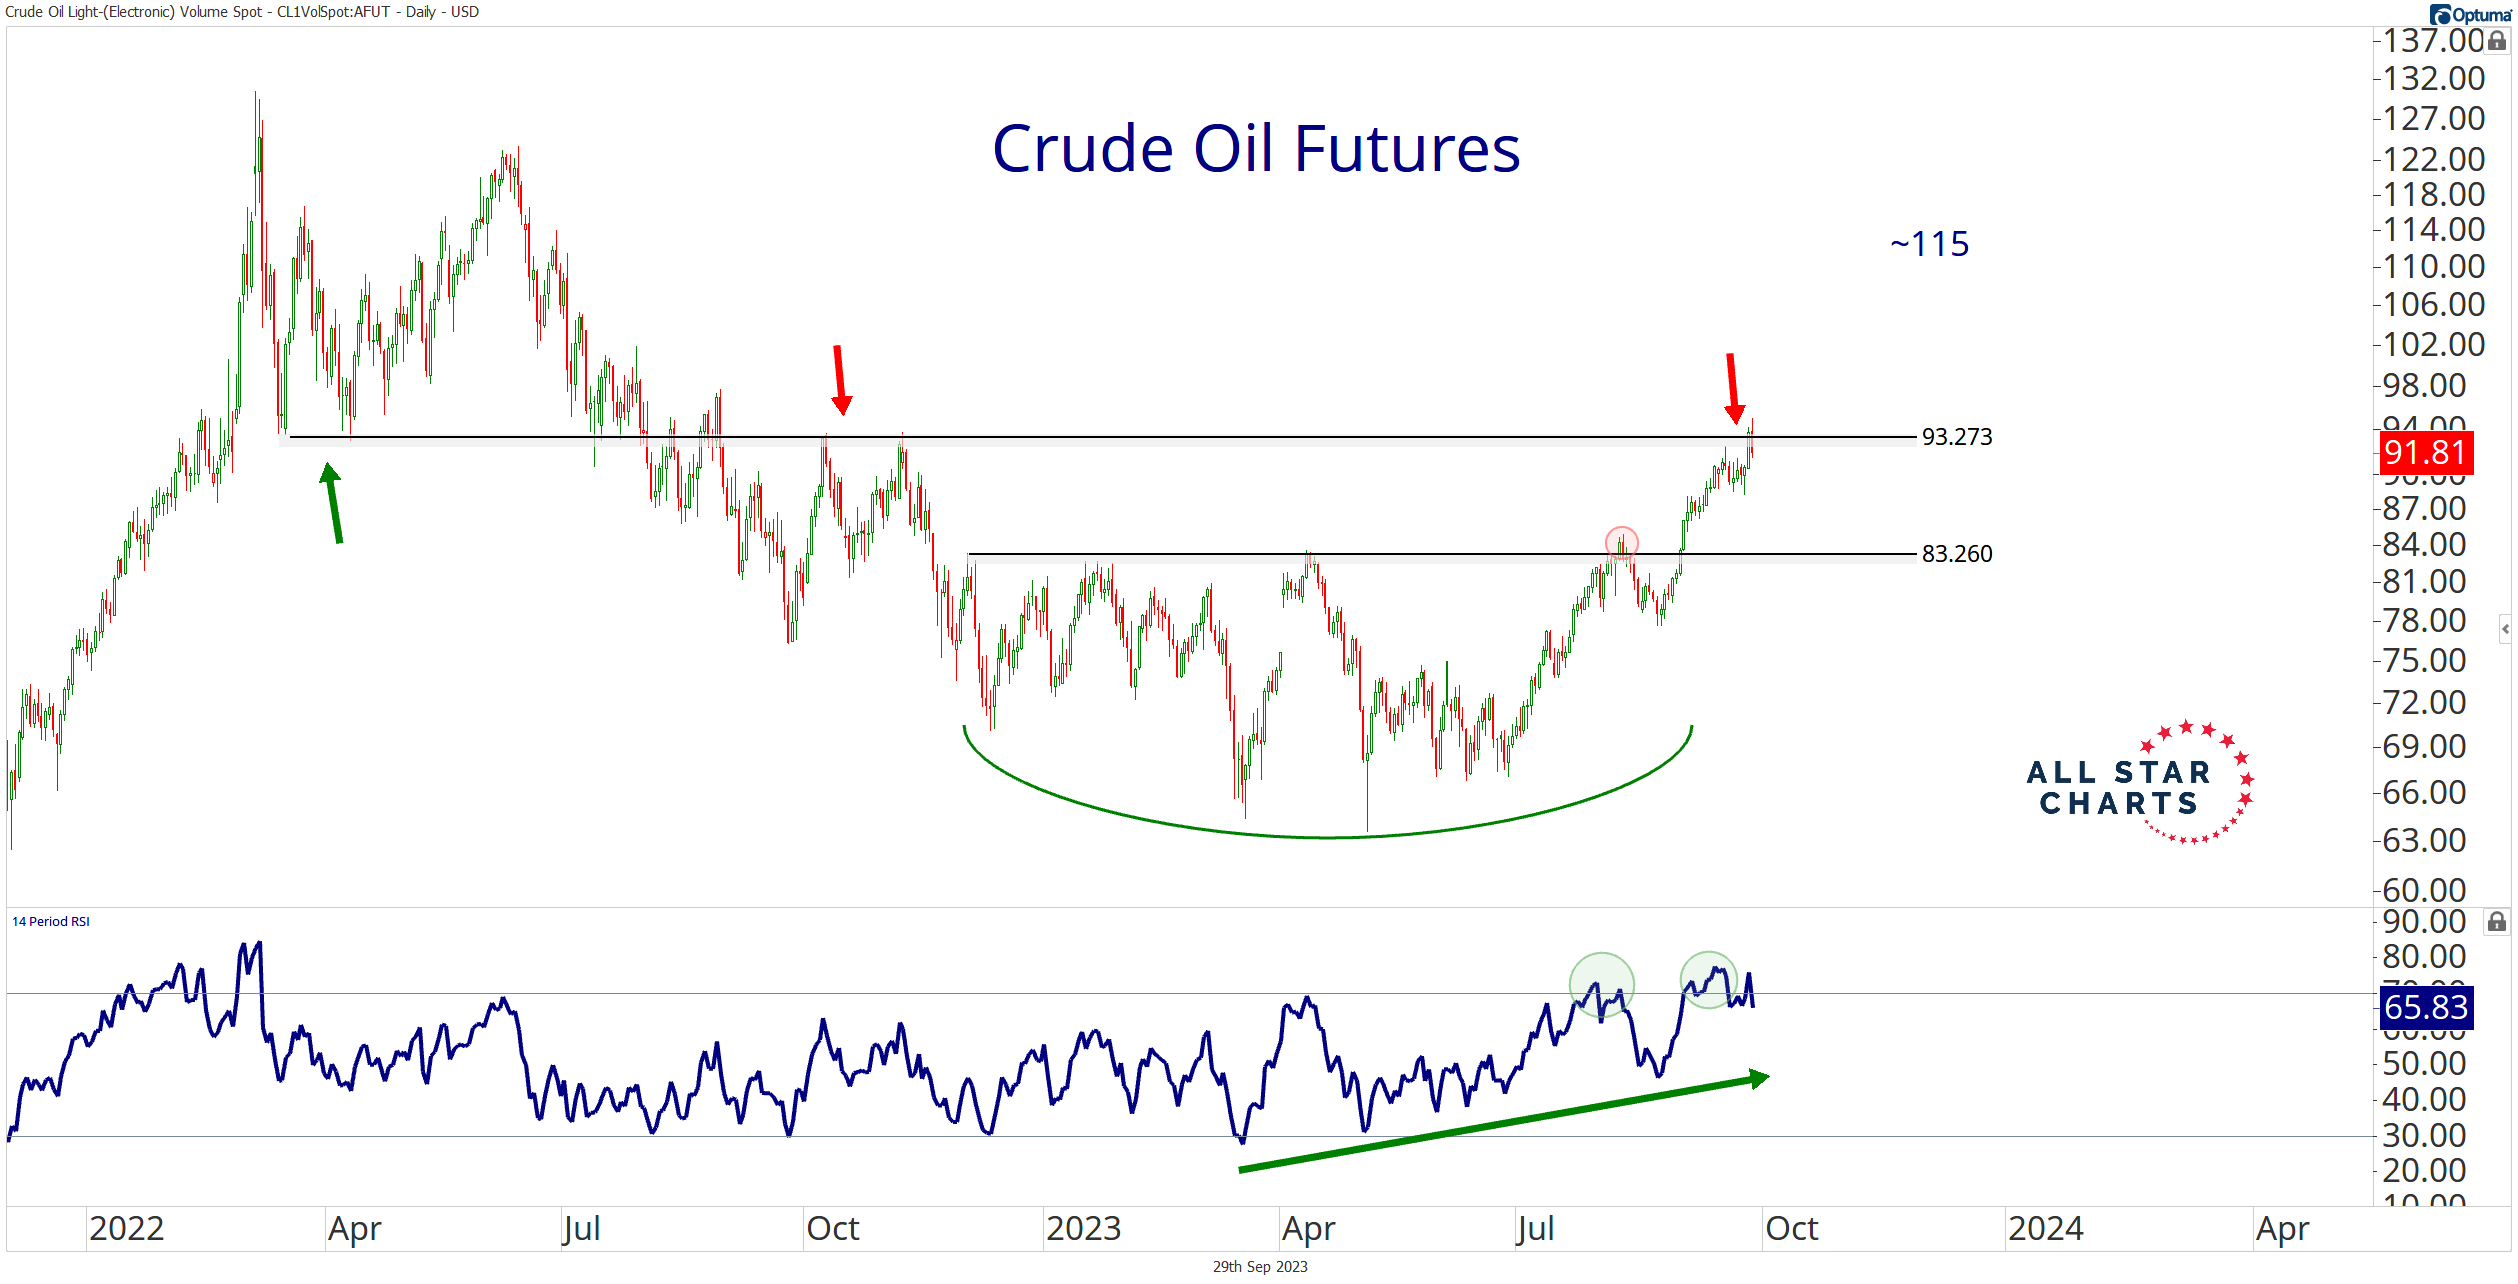
Crude is finding resistance at approximately 93.25 – a key polarity zone. It’s a logical level for crude to pause and digest its recent gains.
A period of consolidation does not detract from the preceding rally. Rather, it’s warranted.
Fresh year-to-date highs and overbought readings on the 14-day RSI are signs of a healthy uptrend. Remember, the strongest trends reach overbought conditions and stay or continue to hit overbought.
Interestingly, wheat has begun to perk up since crude oil kicked into gear this summer.
The main difference between the previous post last spring and now: Wheat no longer trades within a bearish momentum regime.
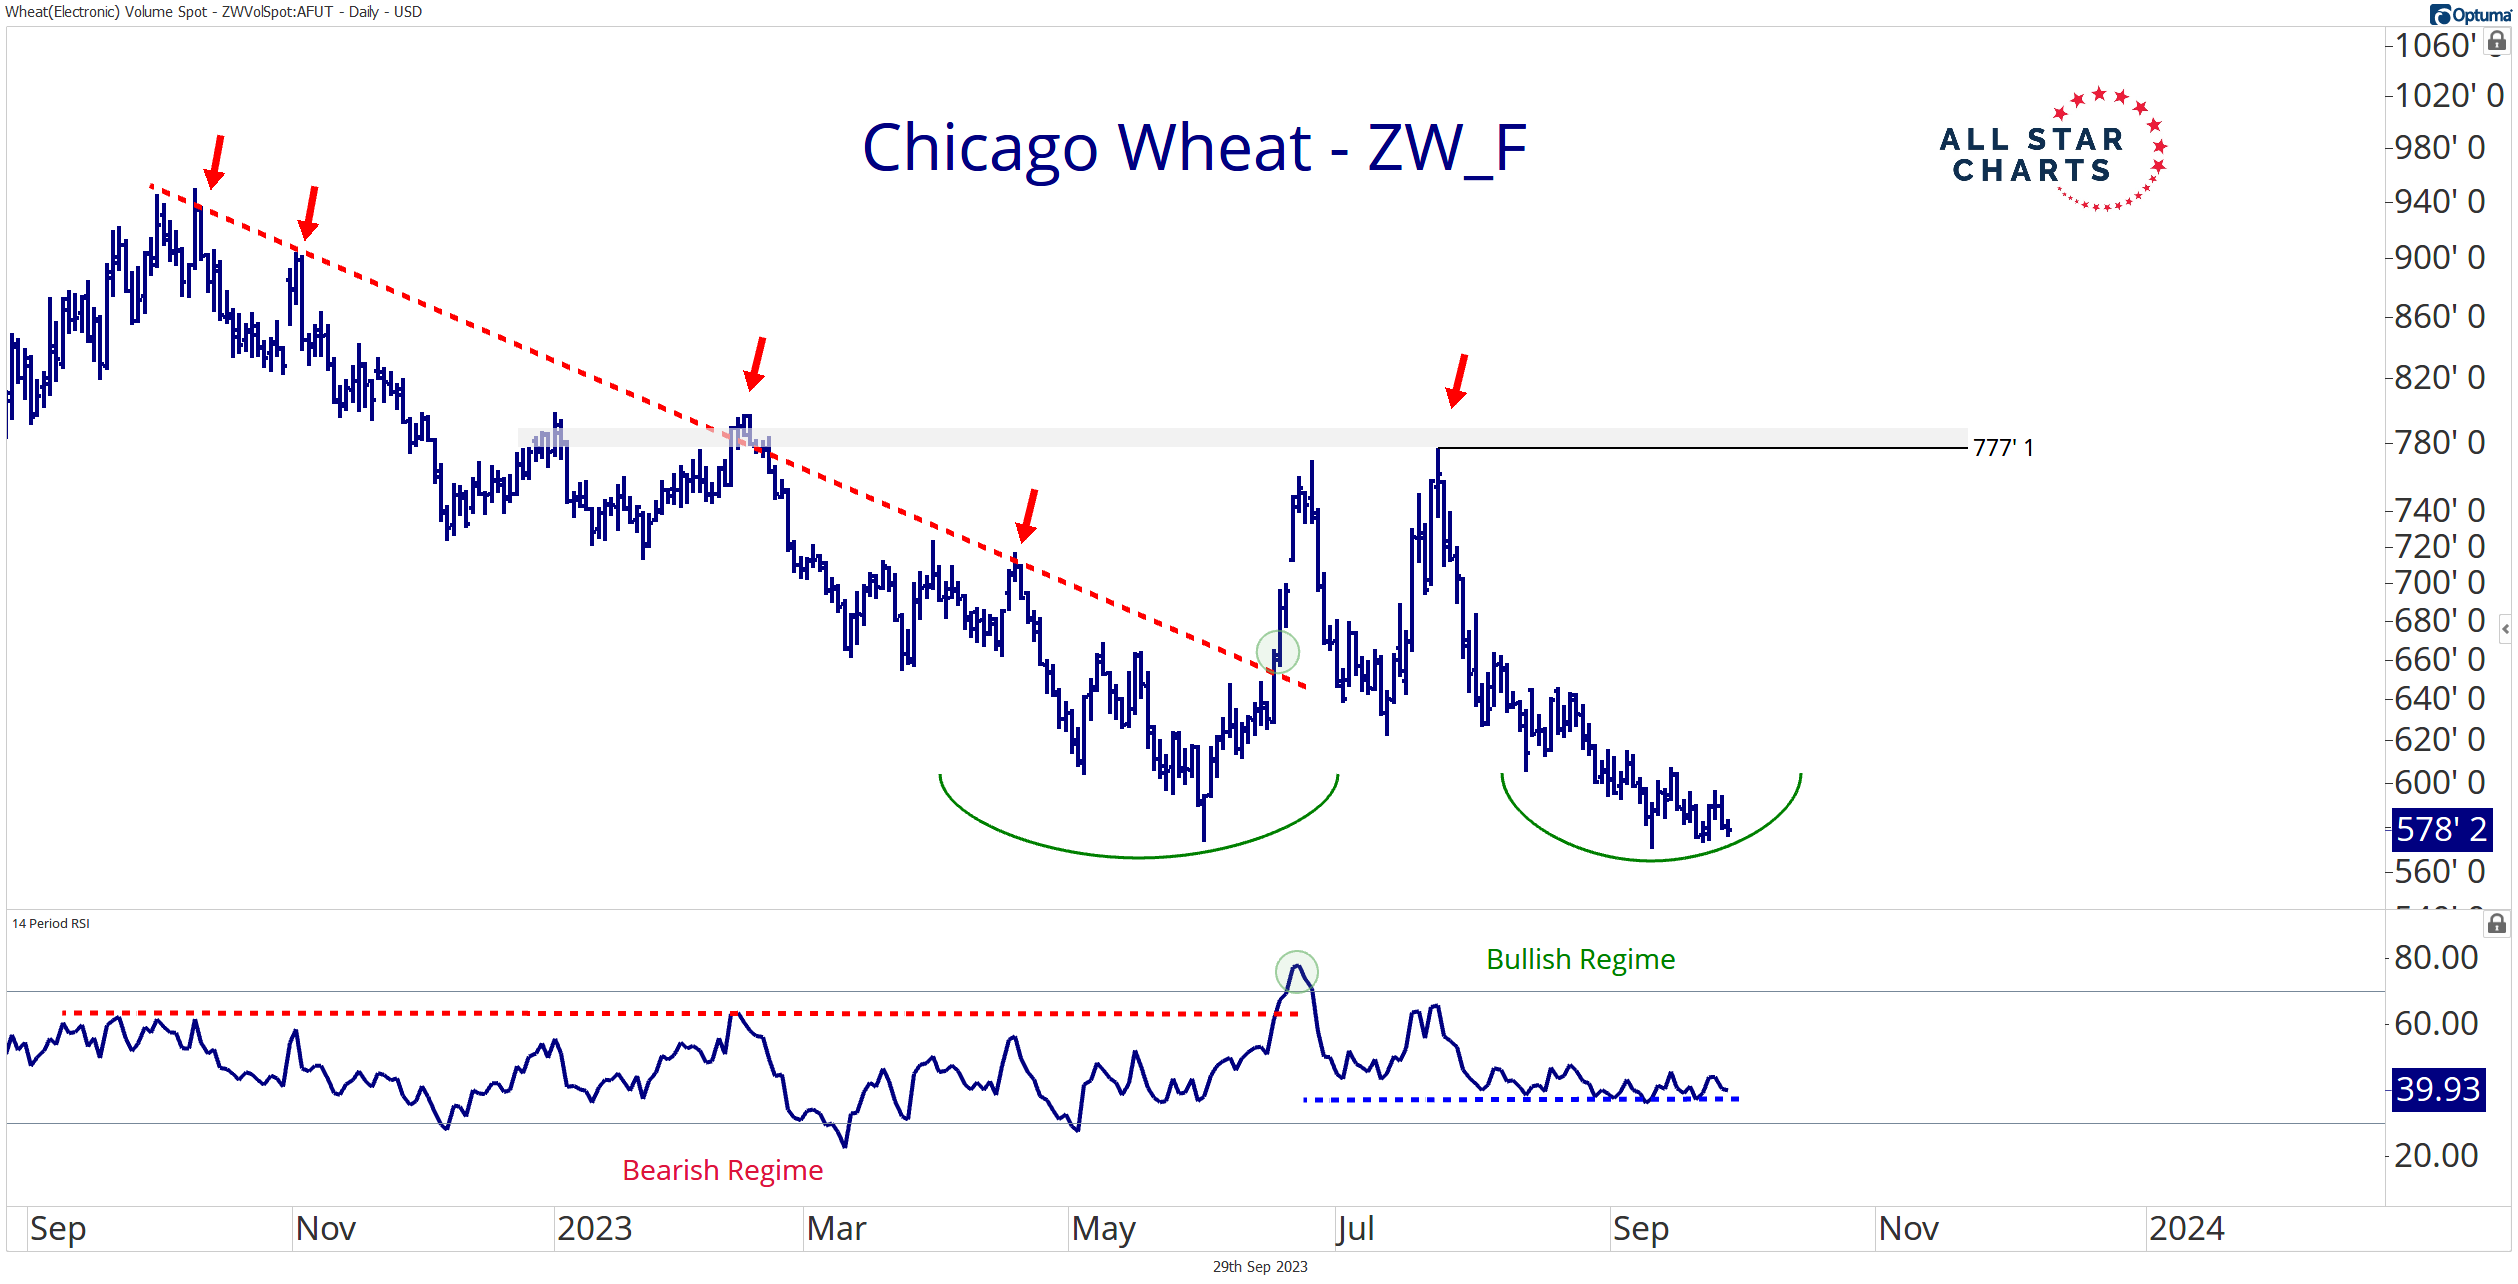
Bearish-to-bullish reversals in momentum are prone to precede bullish reversals in price. And it appears Chicago wheat is carving out a potential double-bottom. Key word: potential.
I’m not one to pick bottoms. It’s not my style.
But if there was ever a place to swing at an off-speed pitch, this is it!
Check out the principle of polarity in action at approximately 570 on the Chicago wheat chart:
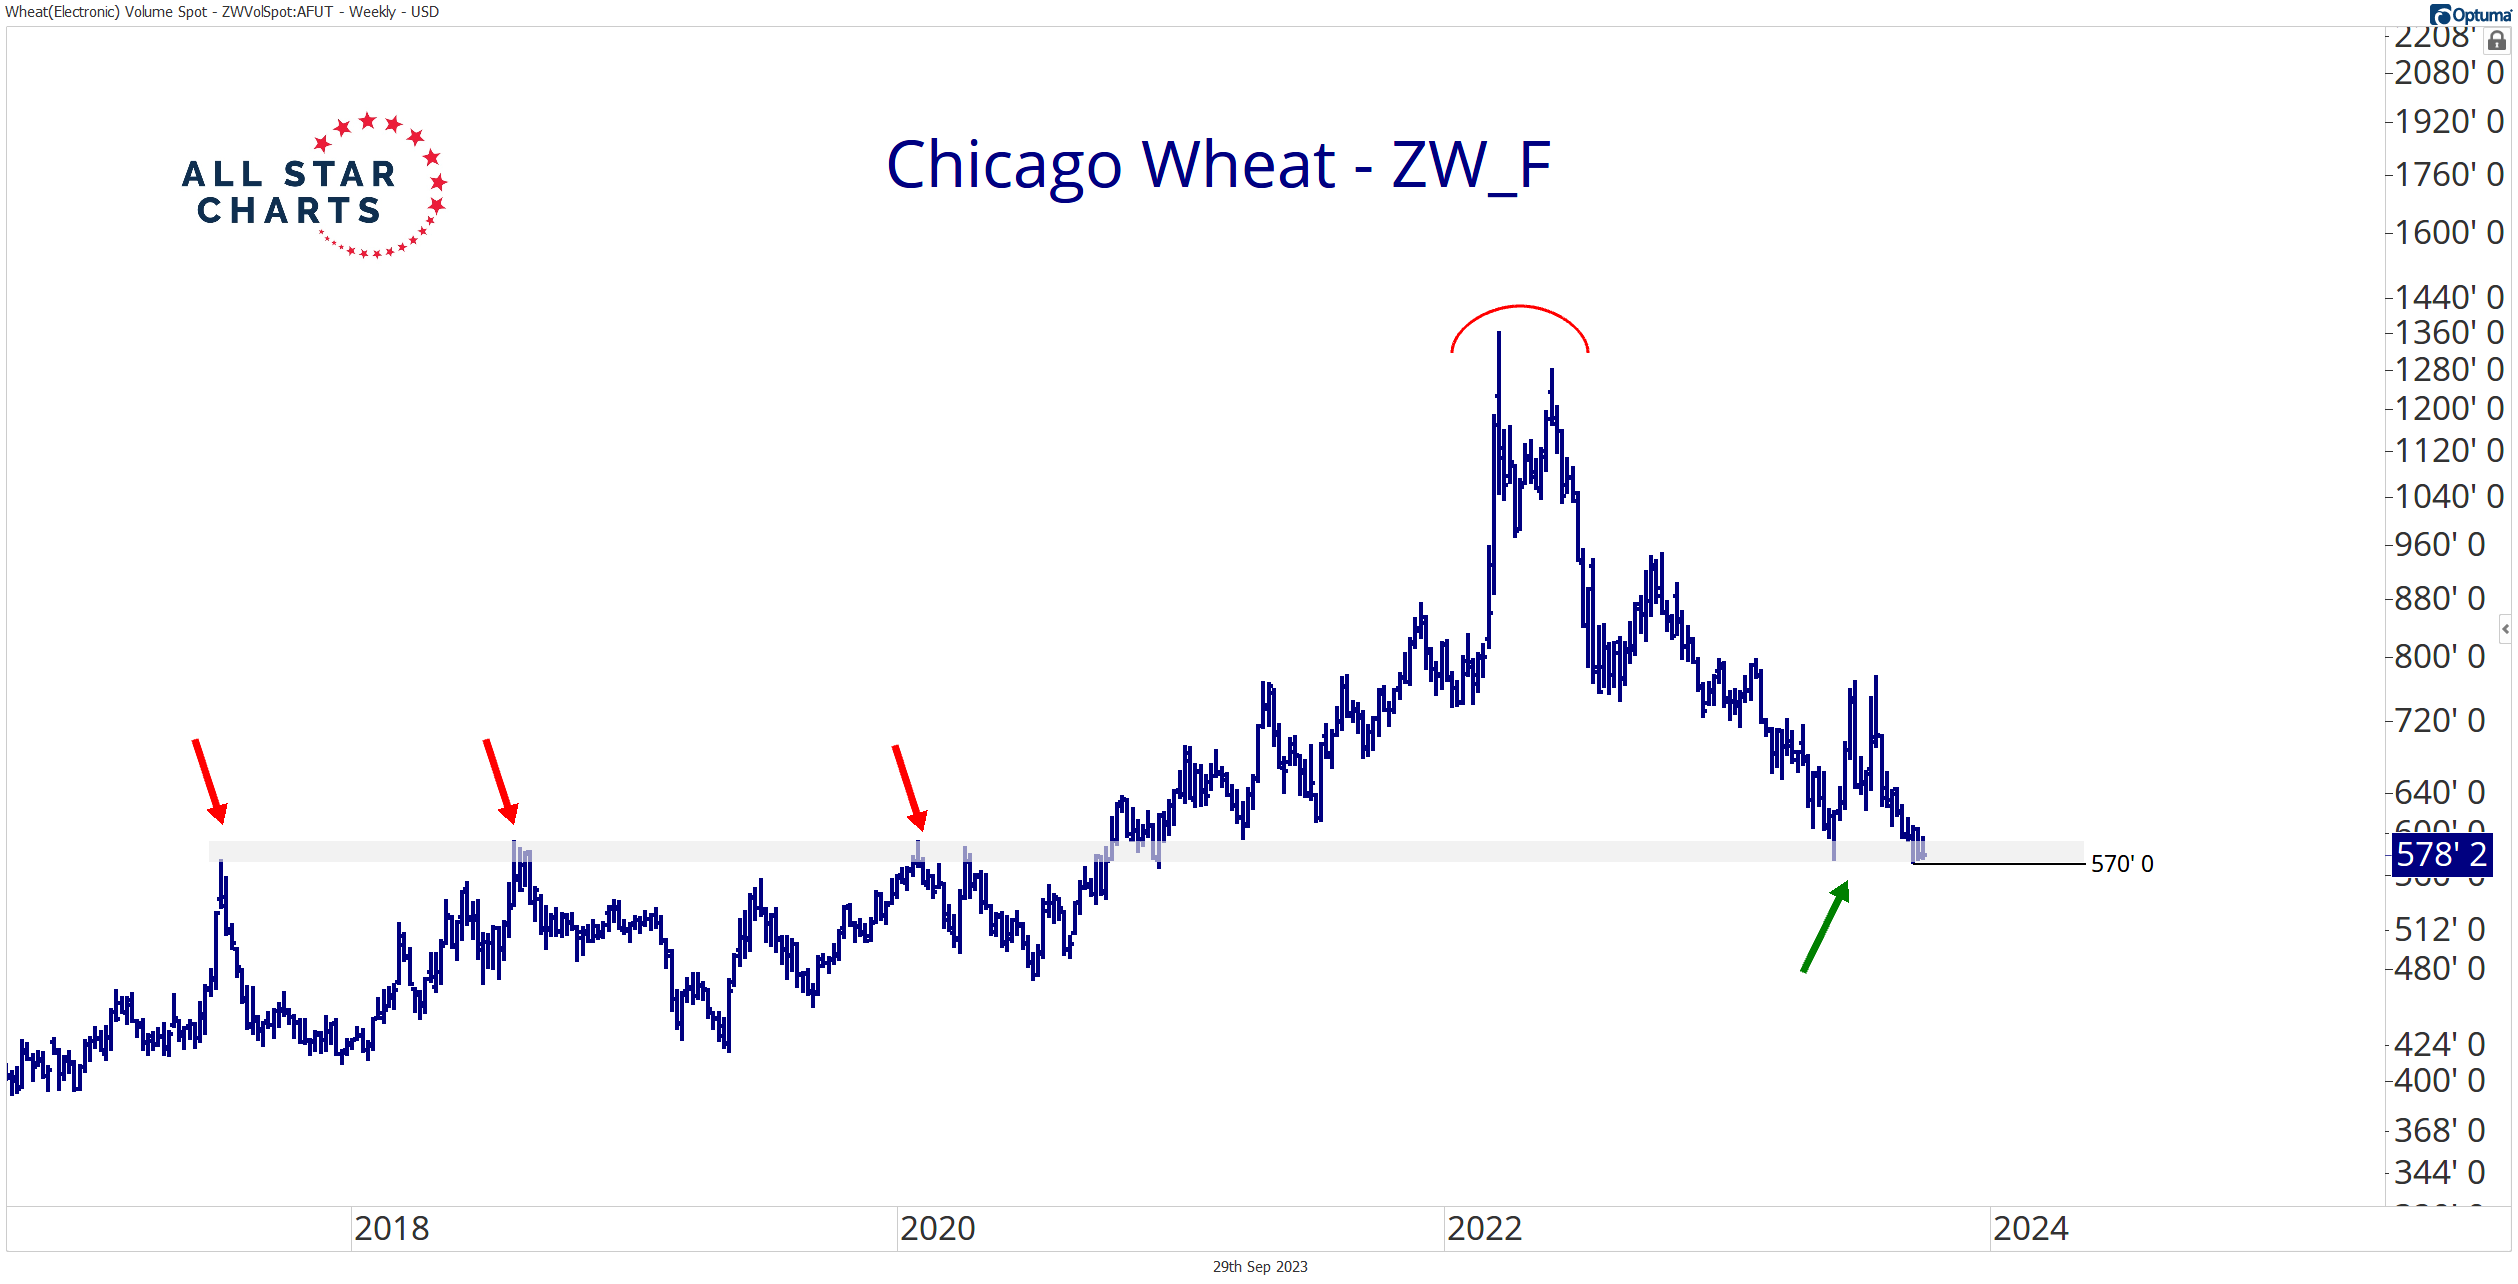
The 570 level coincides with a shelf of former highs from 2017, 2018, 2020, and this year’s lows (as of Thursday’s close).
Resistance turning into support and vice versa isn’t a new development. Edwards and Maggee made the observation a hundred years ago in their classic “Technical Analysis of Stock Trends.” We continue to witness this principle across all markets humans actively trade.
I wish I could say buyers are stepping in to defend this critical level of interest. But Chicago wheat dropped 35 cents during Friday’s session, closing at 539’6.
Regardless, I’m now tracking the 570 level for a potential failed breakdown.
I like buying Chicago wheat if and when it reclaims those former lows, targeting 775.
Wheat bottoms this time of year and tends to follow crude off the bottom.
None of this matters, of course, until buyers drive demand with a relentless bid for Chicago wheat.
Stay tuned!
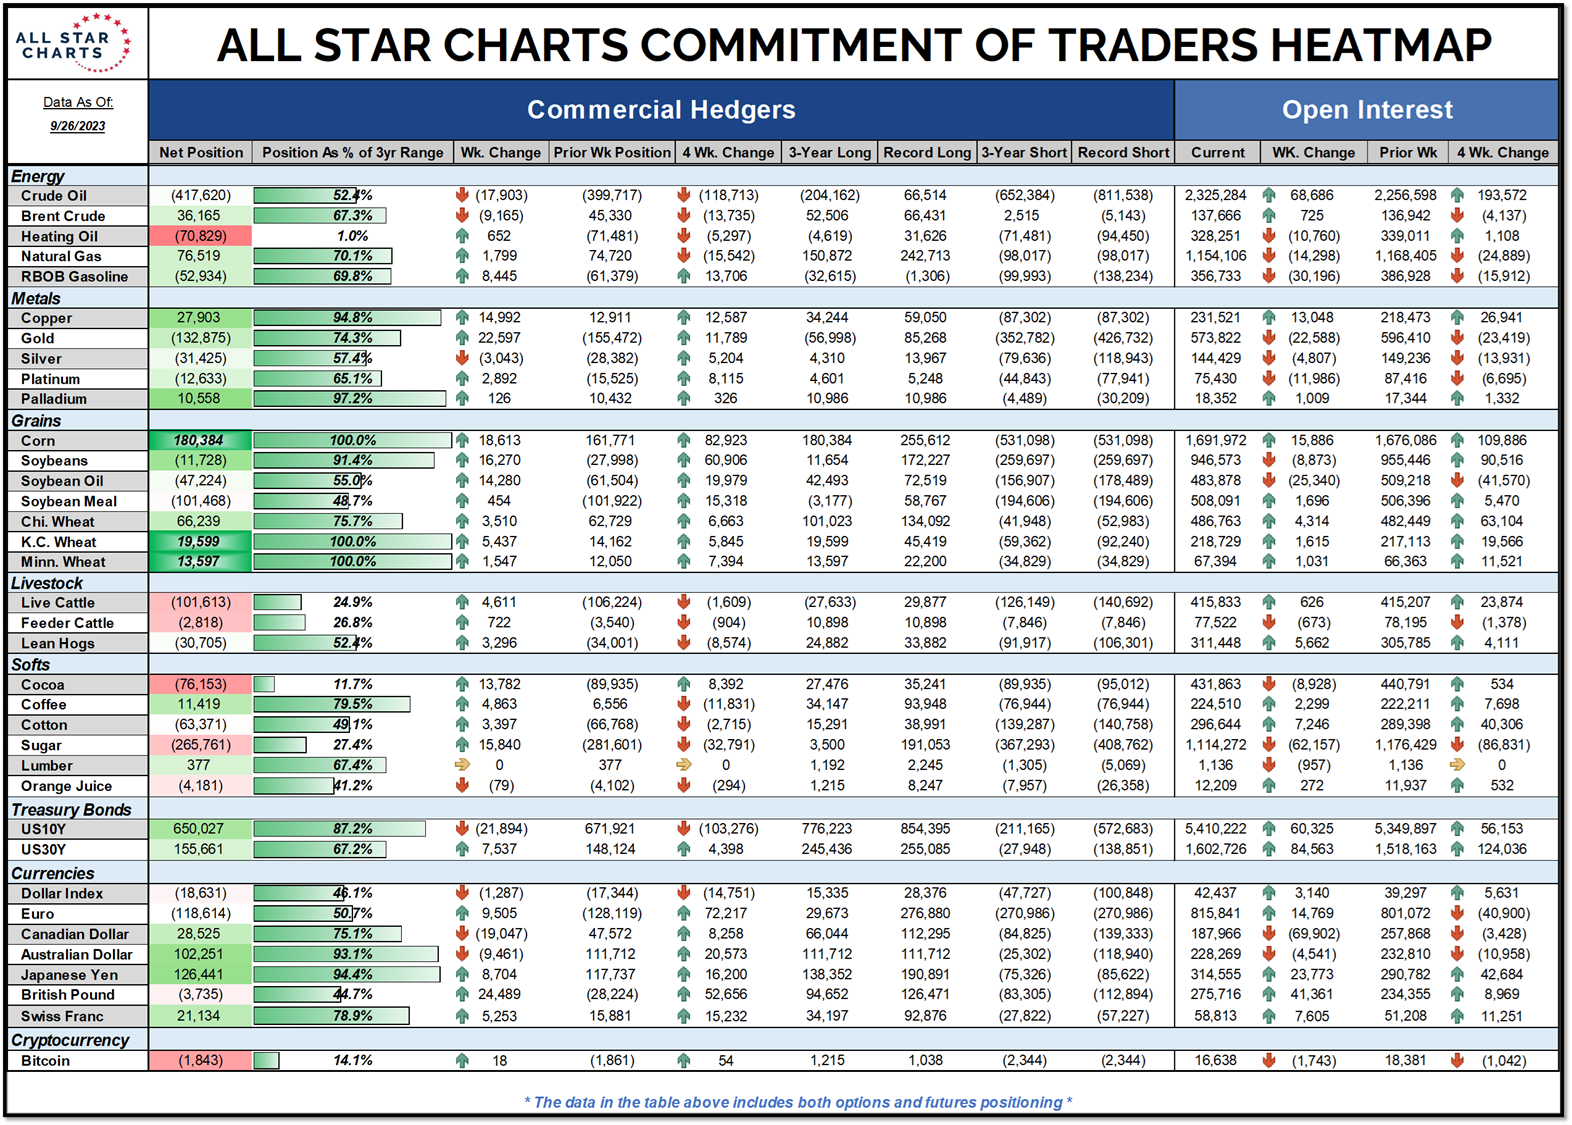
COT Heatmap Highlights
- Commercial hedgers begin to unwind their net-short cocoa position as price corrects lower.
- Commercials are less than 1,000 contracts from their most significant short exposure to heating oil in three years.
- And commercials hold three-year extreme net-long positions for corn, Minnesota wheat, and KC wheat.
Click here to download the All Star Charts COT Heatmap.
Premium Members can log in to access our Weekly Commodities Report Chartbook and the Trade of the Week. Please log in or start your risk-free 30-day trial today.
Be the first to comment