

From the Desk of Alfonso Depablos @AlfCharts
When we talk about market bellwethers, we are referring to large-cap equities that indicate the broader market’s future direction.
These stocks often have a heavy weighting in the most important sectors and indexes, as well as a notable economic impact due to their size and influence.
The world’s largest bank and financial institution, JPMorgan Chase $JPM checks all these boxes and more.
For that reason, we treat JPM as an index itself. Basically, as JPMorgan goes, the market goes.
So with bank earnings underway, what’s the read from this capital market behemoth?
First, here’s a look at JPM overlaid with the S&P 500:
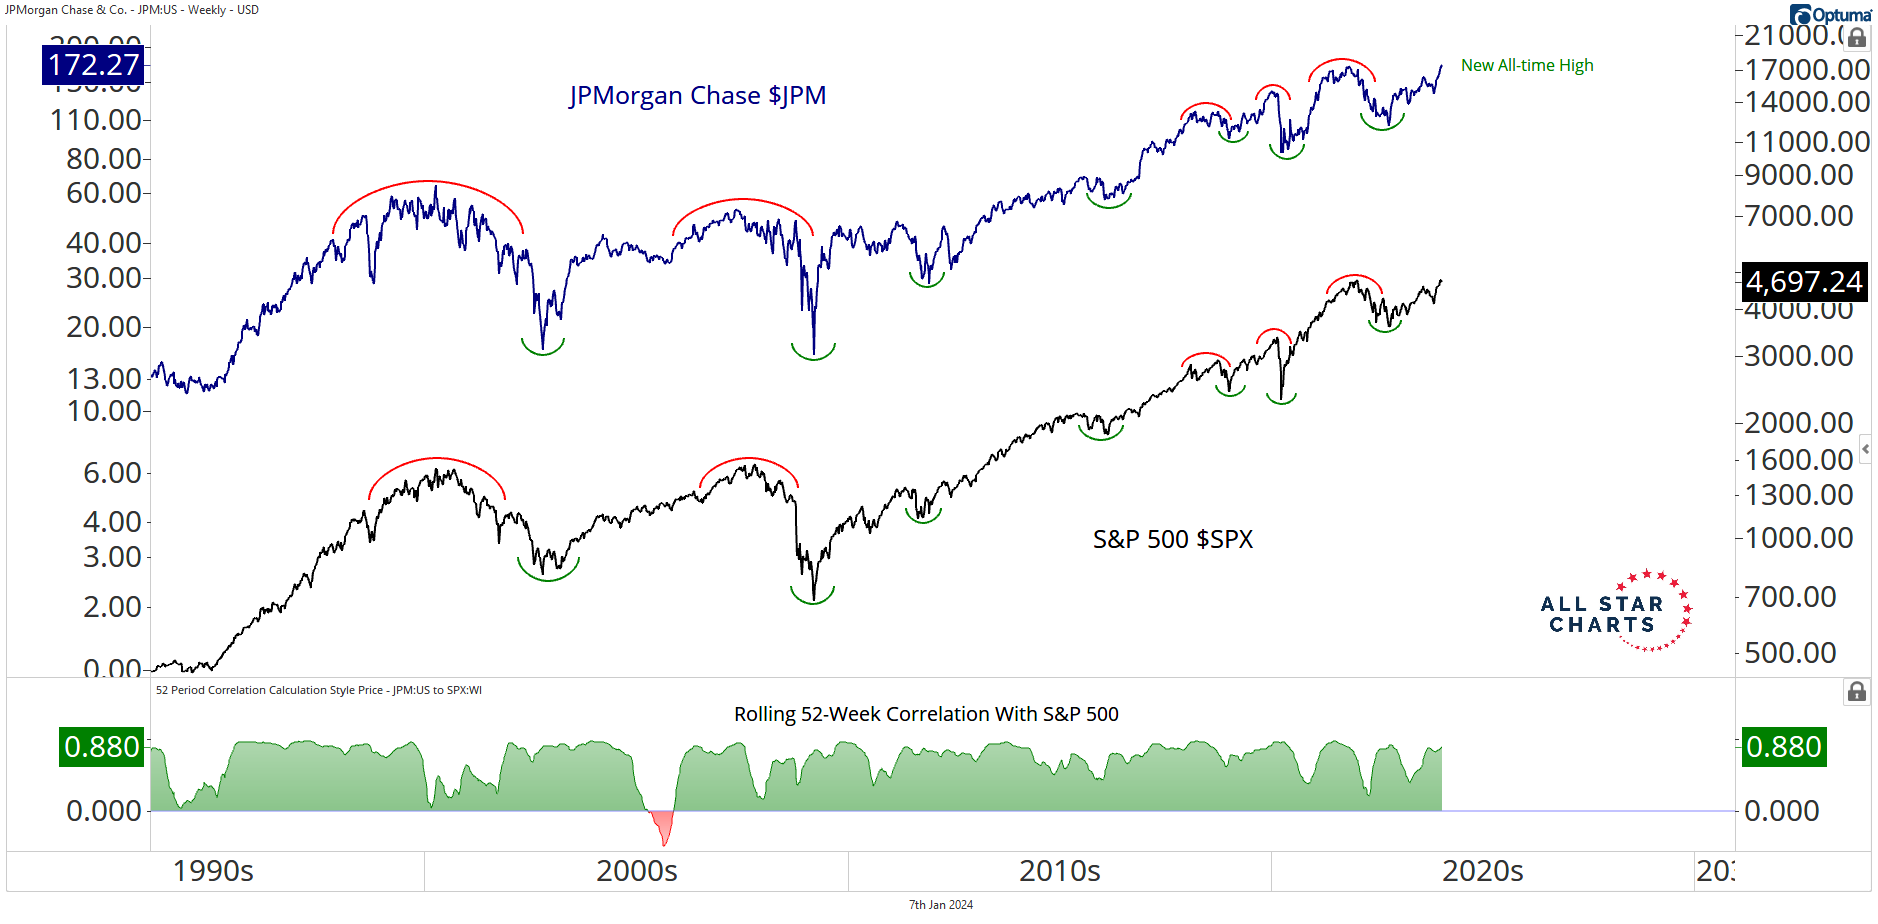
Throughout history, we can observe a consistent and extreme positive correlation between JPM and the overall market. Notice that JPM has been an excellent leading indicator over the past two decades.
If the biggest bank in the US is achieving new all-time highs, we don’t see the stock market and global economy falling apart. In fact, this is nothing more than healthy bull market behavior.
When we zoom in, we see that price is pressing against a critical resistance level from 2021, making it a logical place to consolidate before continuing its upward path.
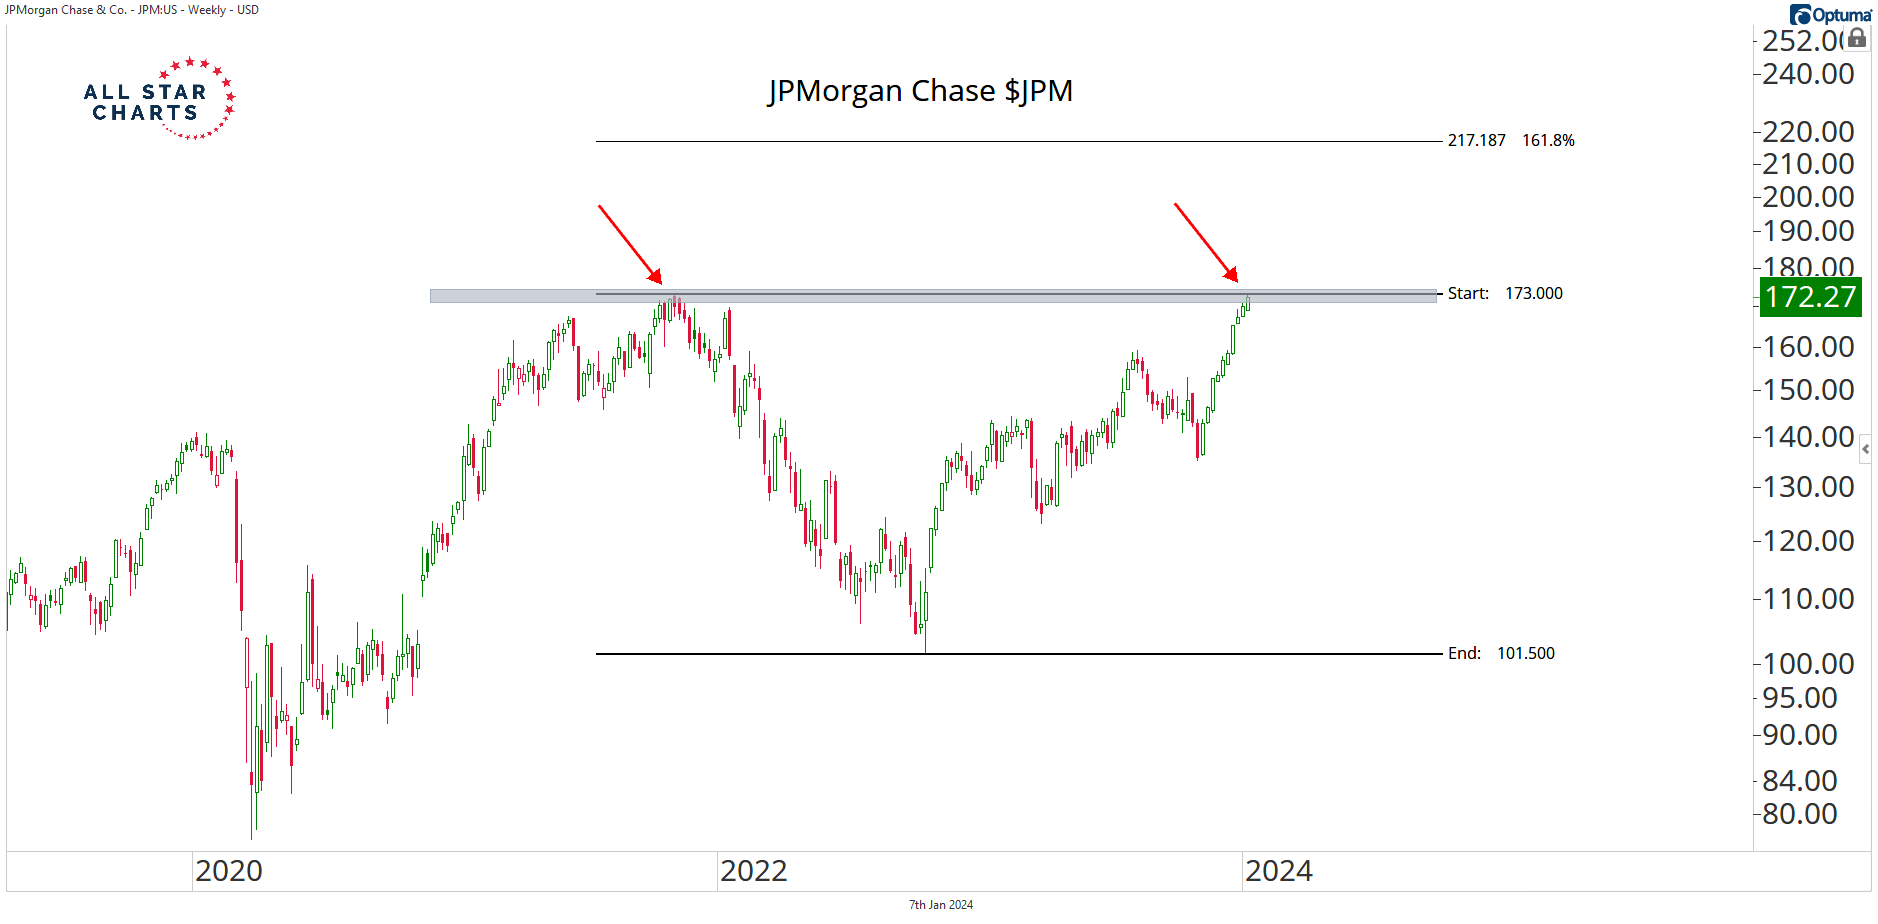
How long will it take to absorb this overhead supply? We don’t know. What we do know is that if this behemoth breaks out with authority, it will represent a major feather in the hat for risk assets.
The line in the sand lies at 173.
Above that level, we can take a shot and get long with a target near 217. However, below 217, we don’t want to touch it.
We hope you enjoyed this post. As always, please reach out with any questions.
Alfonso
Be the first to comment