

From the Desk of Ian Culley @IanCulley
Metals are dominating the commodity space.
The rotation between energy and base & industrial metals colors the commodity markets as we near 2024.
Crude oil has slipped through buyers’ hands since interest rates peaked in October. That much is obvious…
But don’t short crude oil and its distillates just because copper and gold are catching a bid…
Check out the commodity subgroup performance since the US 10-year yield $TNX peaked in the fall:
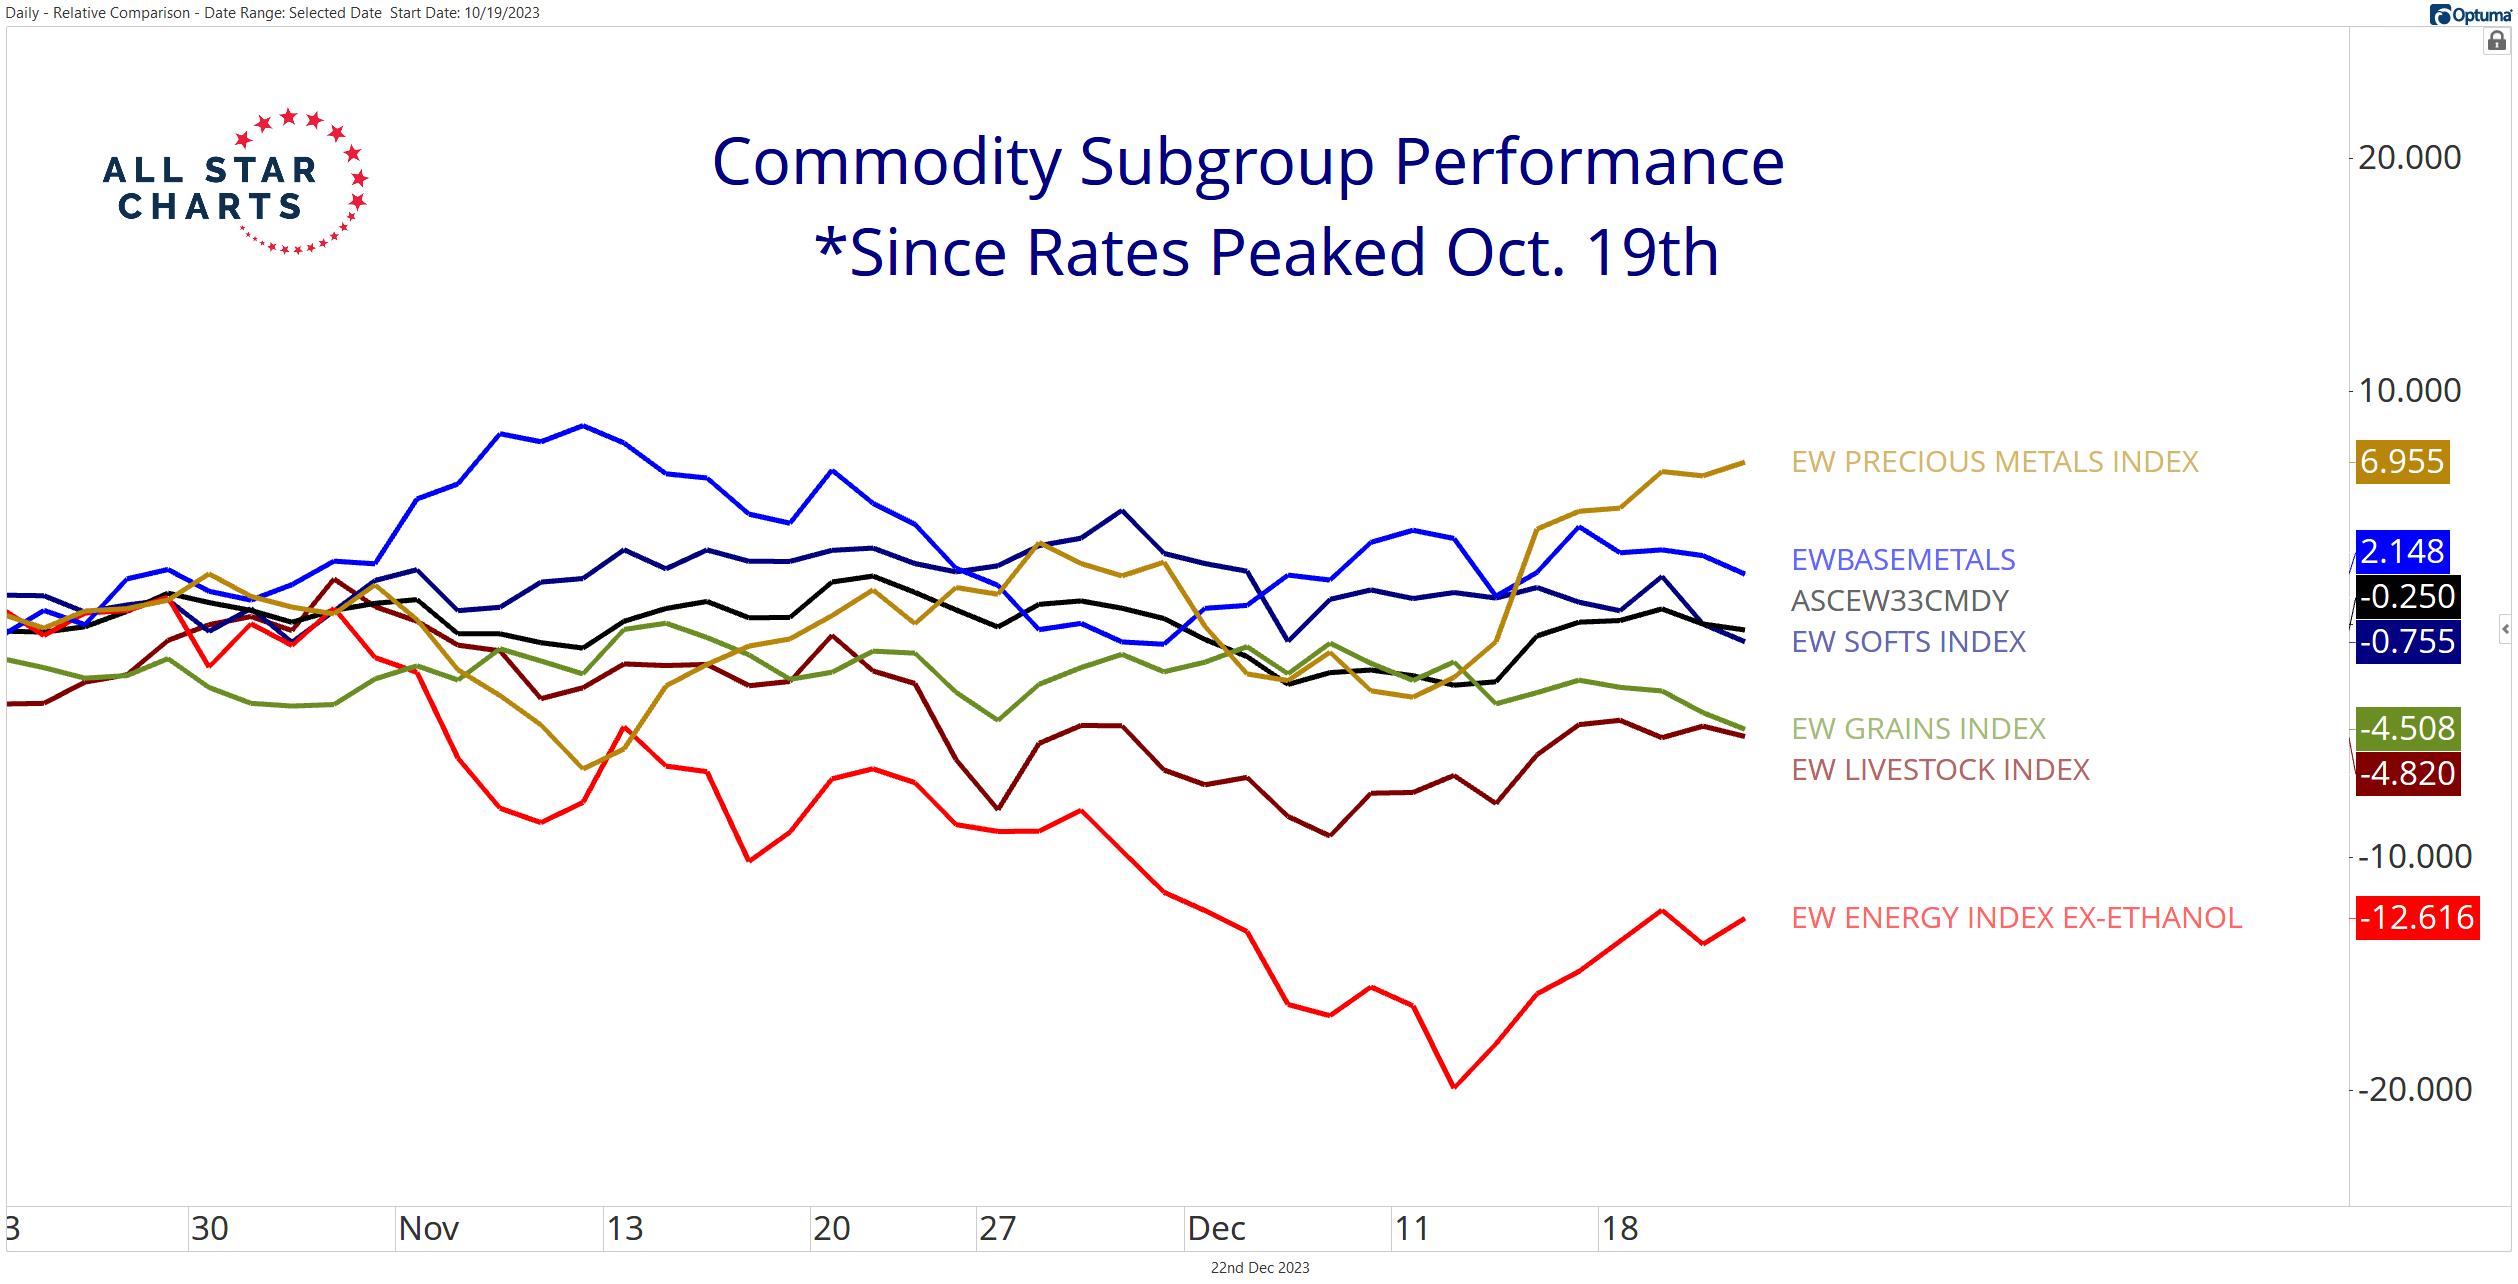
Energy has clearly cooled, while precious and base metals have led the pack.
This makes sense as rates fall. But markets don’t move in a straight line.
Notice the equal-weight energy index stopped falling mid-month around the same time it ran into a logical area of support relative to the equal-weight base and industrial metals index.
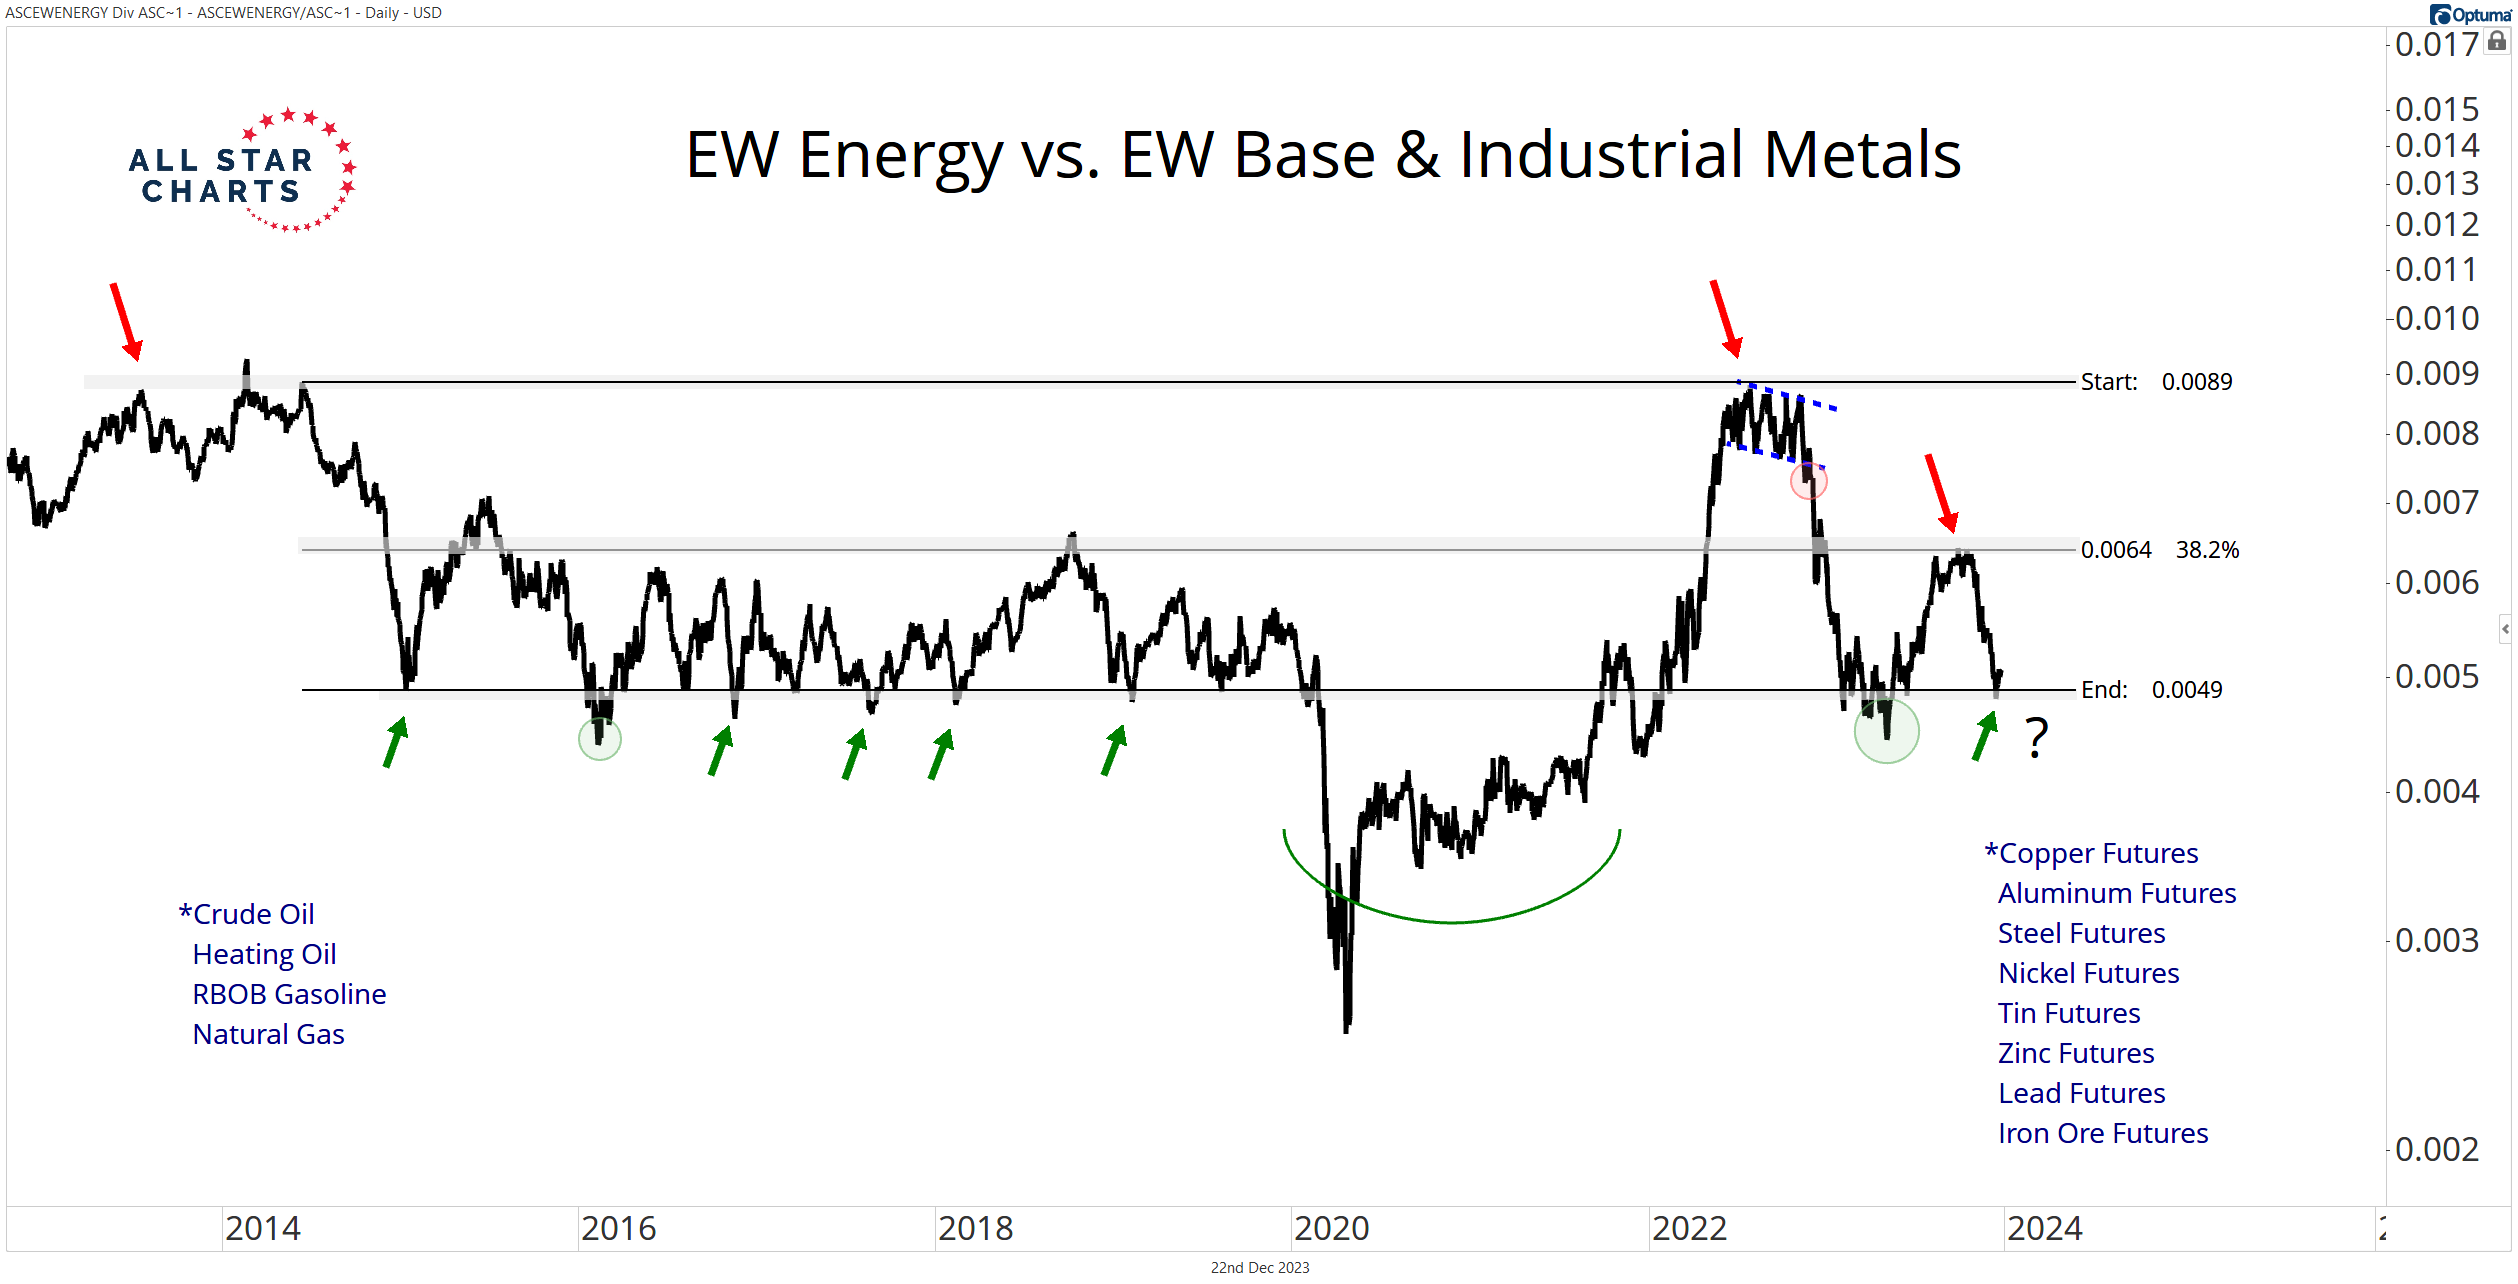
Coincidence?
I think not.
In fact, yellow and black gold have rallied in tandem over the near-term (gold +3.0% and crude +8.00% since Dec. 13th.)
It doesn’t matter whether we’re talking about gold or copper — metals and energy contracts can enjoy a simultaneous bid.
Crude’s near-term strength also comes as its distillates – gasoline and heating oil – catch a bid (highlighted by the crack spread).
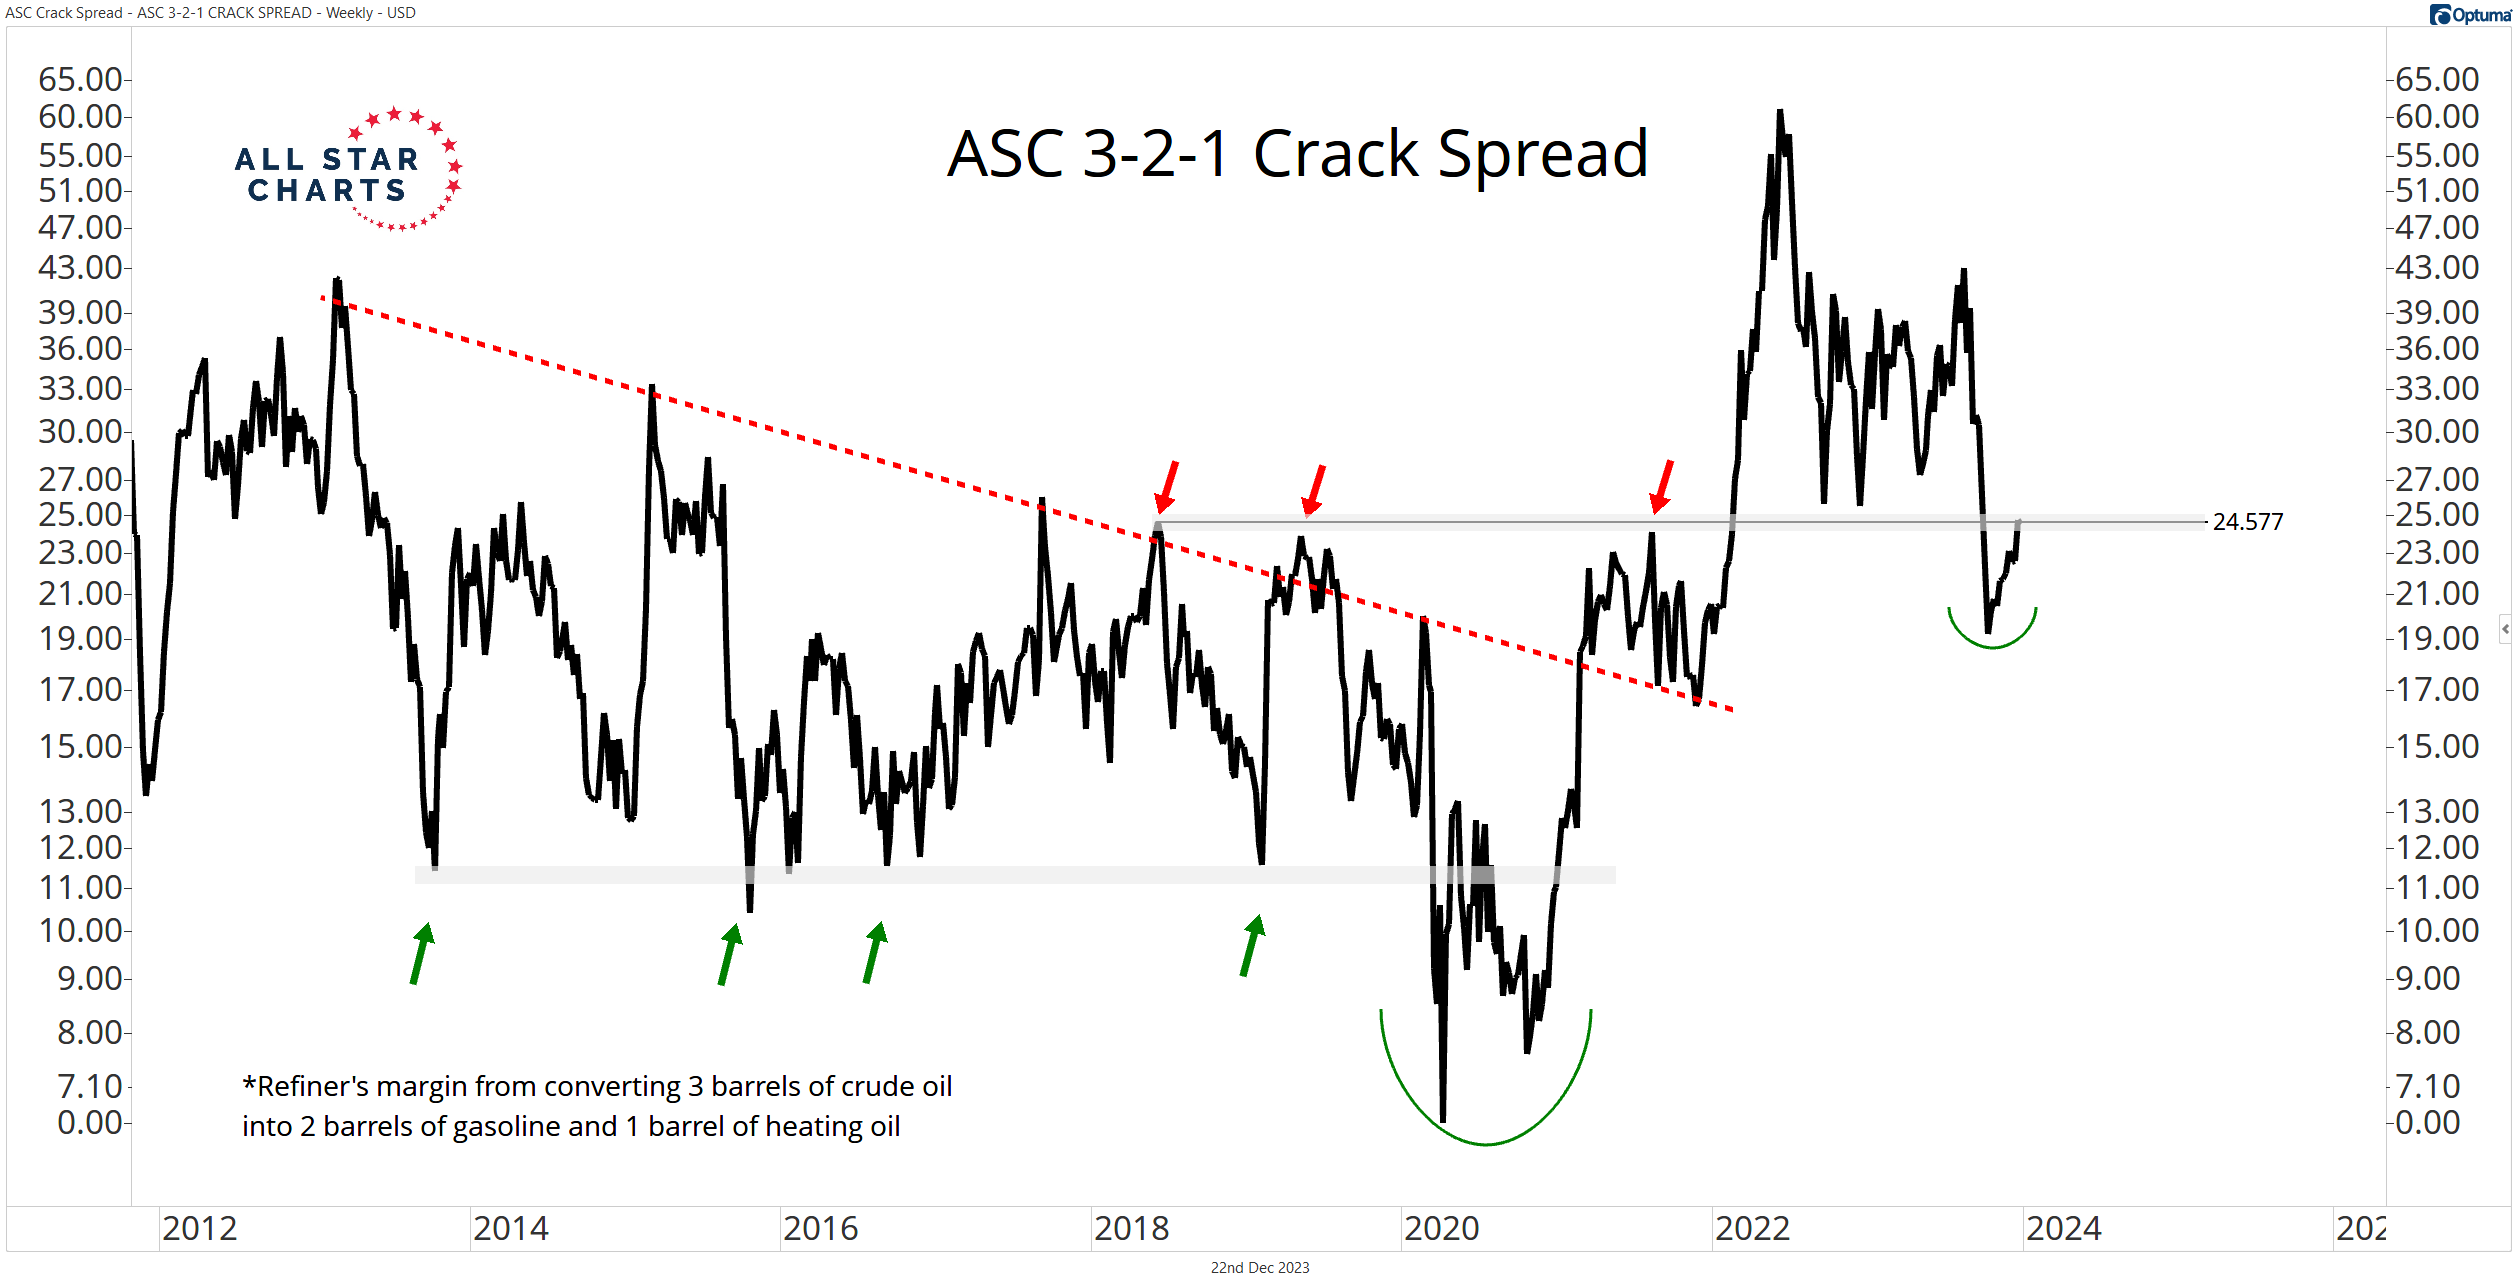
This is classic bullish behavior supporting further upside in crude oil.
A continued widening of the crack spread above 24.50 would be constructive for energy bulls.
We can trade the crack spread, of course. However, I prefer to focus on crude oil futures.
The 75 level marks my tactical line in the sand:
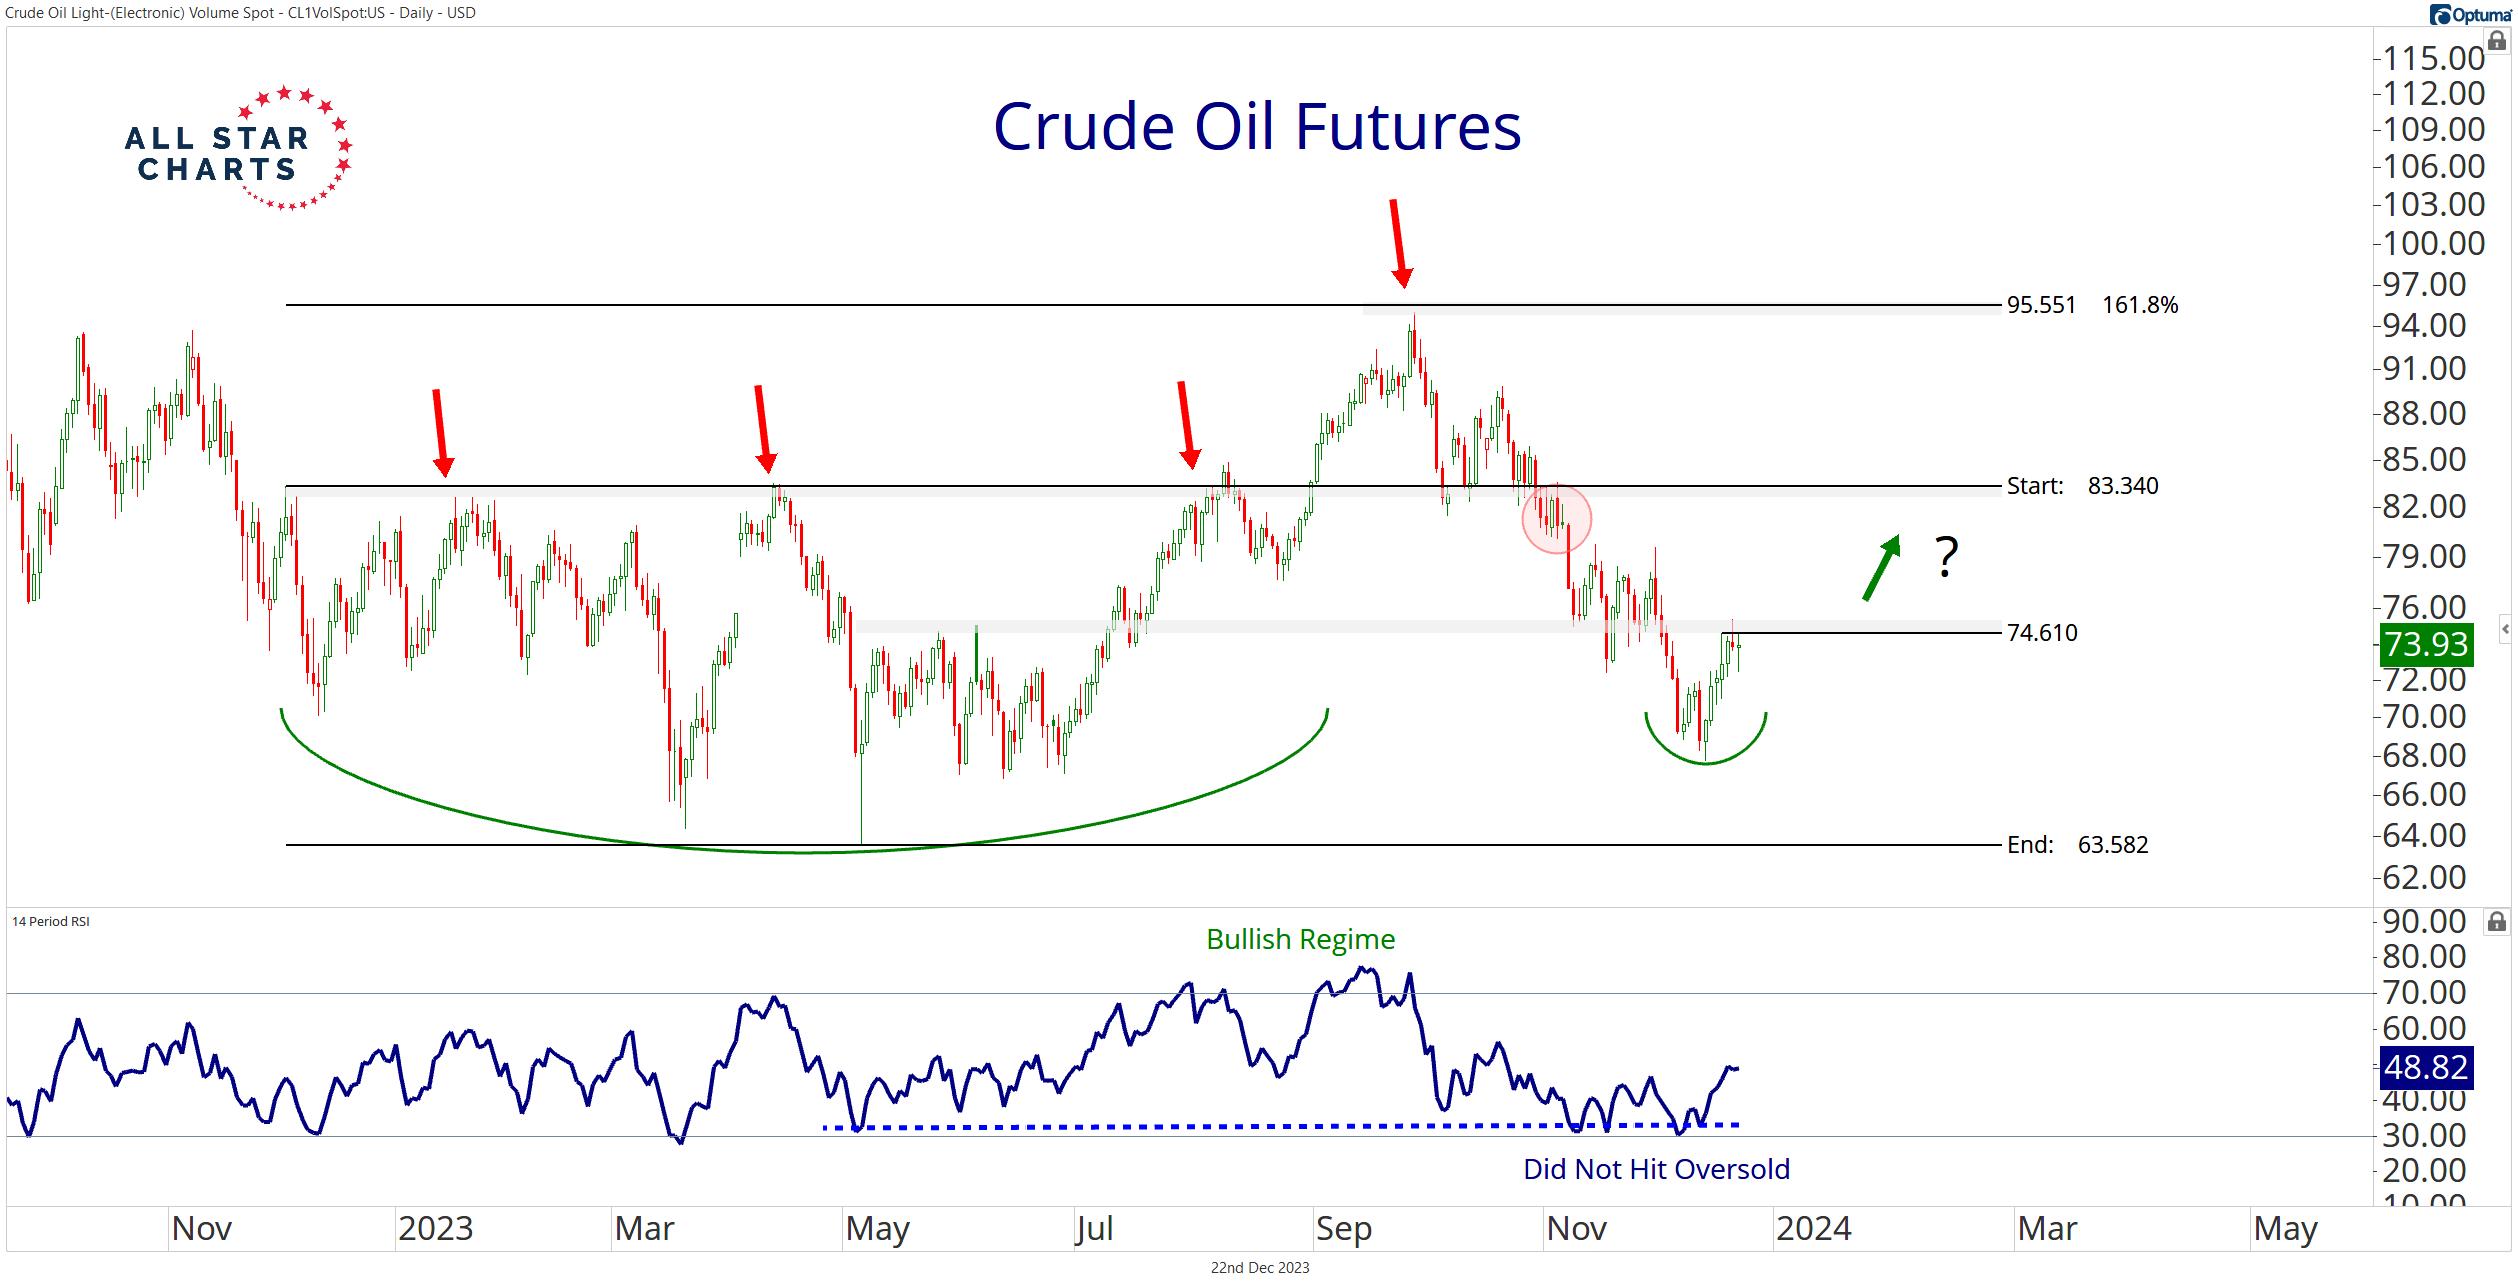
It worked earlier this summer. And price has respected that level as resistance and support in recent months.
I like buying crude on a decisive close above 75, targeting 83.
It’s hard to imagine energy stocks taking a hit if crude oil and its distillates continue to rally. My mind also turns to the grain markets, especially wheat.
Bottom line: Metals are showing relative strength, but that doesn’t mean it’s time to ditch energy.
Stay tuned!
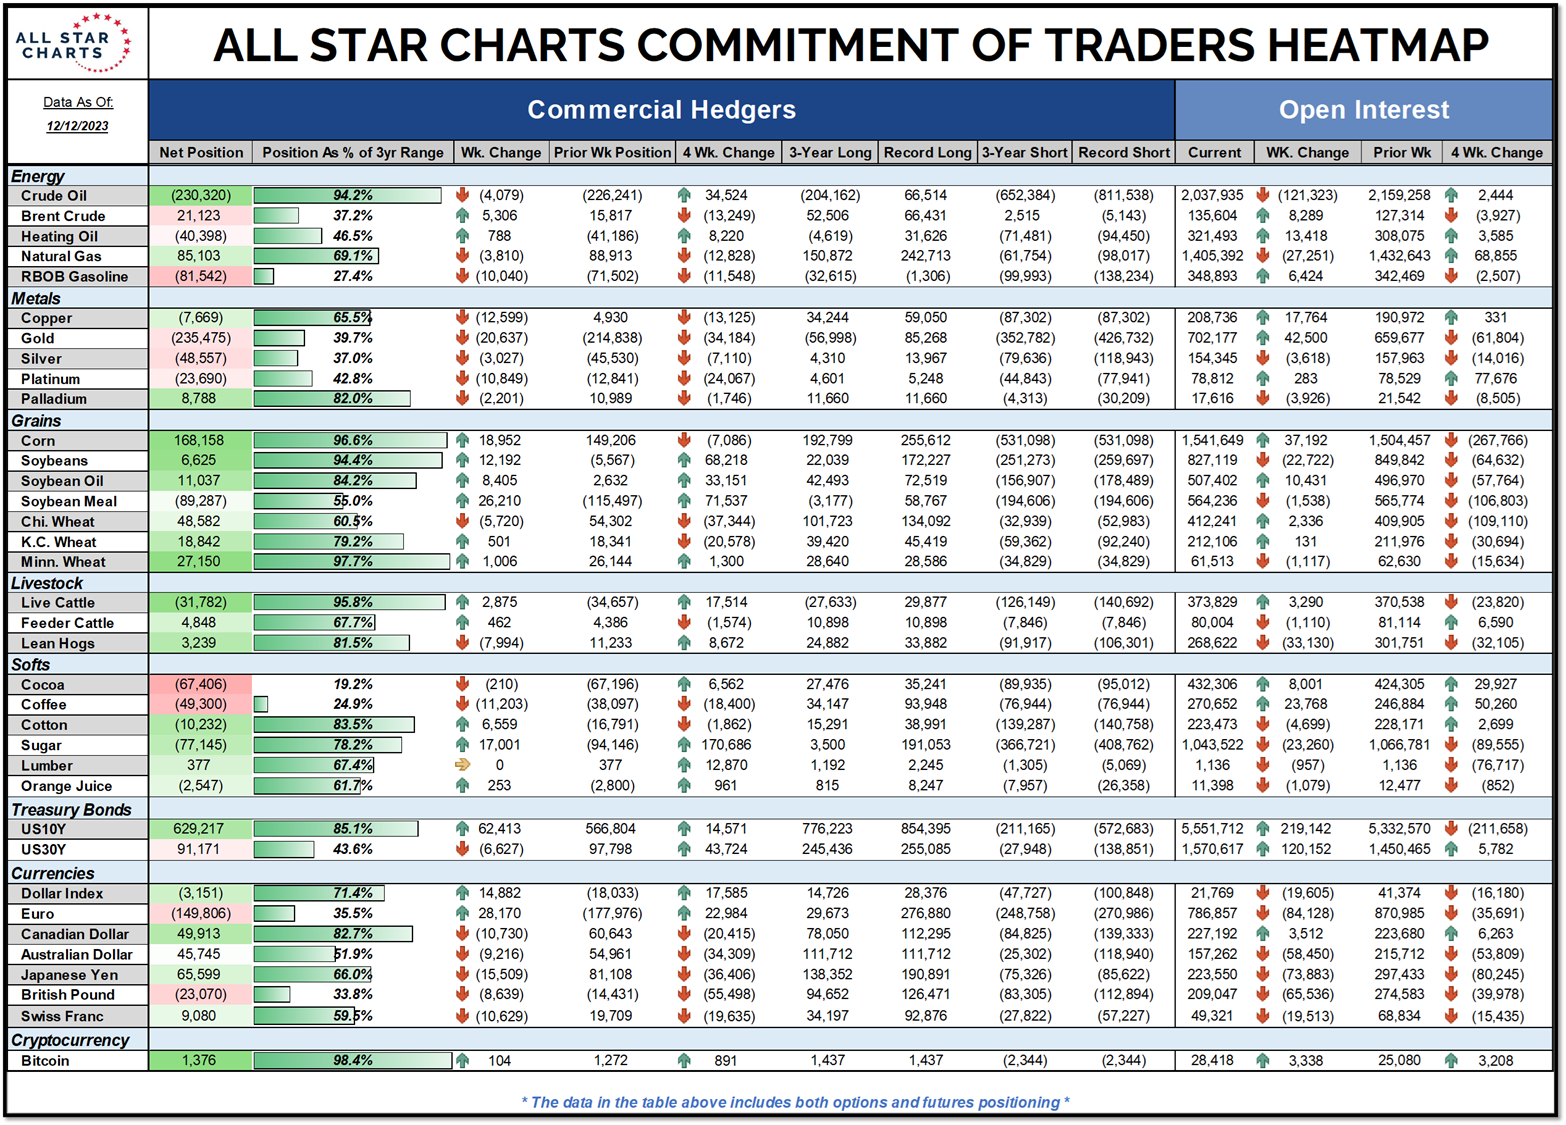
COT Heatmap Highlights
- Commercial hedgers pile on the bitcoin longs as they approach their largest net-long position in three years.
- Commercials pull within four percent of their largest long position for corn in three years.
- And commercials are less than three percent from a three-year record-long position in Minneapolis spring wheat.
Click here to download the All Star Charts COT Heatmap.
Premium Members can log in to access our Weekly Commodities Report Chartbook and the Trade of the Week. Please log in or start your risk-free 30-day trial today.
Be the first to comment