

I was once again working with the grouping feature in Power BI Desktop.
This time I had a lot of values that I wanted to put into multiple groups. I also did not want to select the individual values (I have previously shown this in my blog post Creating a group with all values (Even if not in the data) in Power BI)
It is amazing that sometimes it takes me a while to fully understand how to use some features in Power BI and today was one of those days!
The one challenge is that in the future I cannot predict what the Sales Tax would be, so it I needed to find a way to be able to group them accordingly.
As shown with my example below I have a whole range of values from 60 all the way to over 4000.

In Power BI desktop, I went to my Sales Tax column, right clicked on the column, and selected “New Group”.

Next, in the Groups window I changed the Group type to “List” and then put in any single value into the “Groups and members” as shown below.
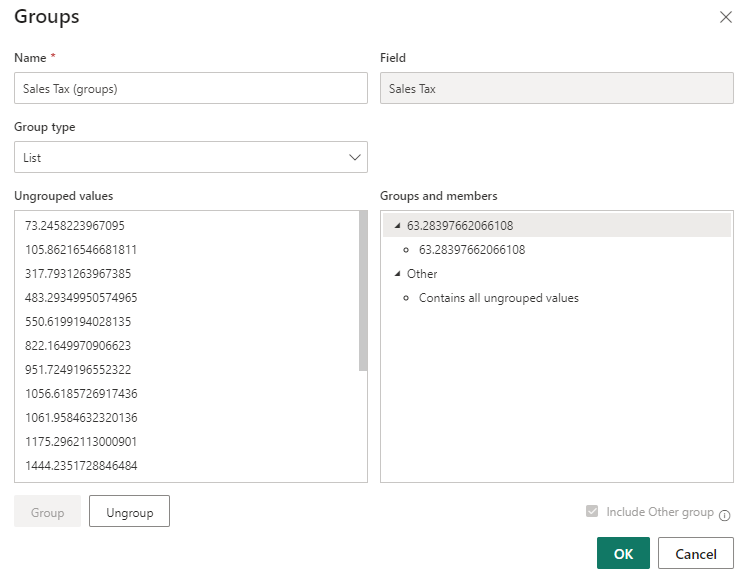
The reason I did this is because I wanted to create the group quickly and easily.
I then went to one of my favourite Power BI tools, Tabular Editor and connected it to my PBIX File.
NOTE: I did make sure that in Tabular Editor I enabled the “Allow unsupported Power BI features (experimental)

I then navigated to my table, and I could see the group I had created.

And here is what the DAX looked like once I had finished my groupings.
On the right-hand pane I could see the DAX.

And this is where my lightbulb moment went ON. Ahhhh this is just DAX so I can write any DAX syntax for the grouping!!
What I then did was to create the grouping as shown below which was based on the requirements from the business users.
SWITCH(
TRUE,
ISBLANK(‘Table'[Sales Tax]),
“(Blank)”,
‘Table'[Sales Tax] >= 0 && ‘Table'[Sales Tax] < 100,
“0-100”,
‘Table'[Sales Tax] >= 100 && ‘Table'[Sales Tax] < 1000,
“100-1000”,
‘Table'[Sales Tax] >= 1000 && ‘Table'[Sales Tax] < 4000,
“1000-4000”,
“4000 +”
)
I then clicked on Save in Tabular Editor
When I went back into Power BI Desktop, I could see that I needed to refresh the calculated columns for the changes to be made. I clicked on Refresh now.

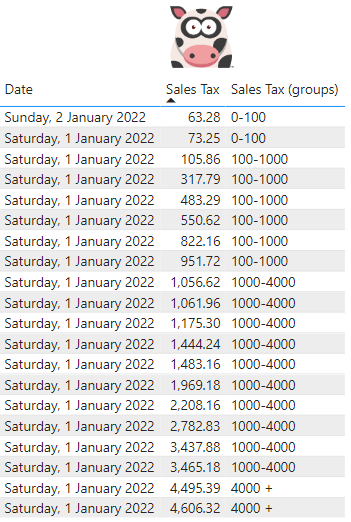
I then put in my grouping column “Sales Tax (groups) into the table and I could see groupings working as expected.
In this blog post I demonstrated how I created a better way for my groups to be displayed.
I hope that you found this useful and if you have any comments or suggestions, please let me know.
Be the first to comment