In this tutorial, you’ll learn how to evaluate a DAX code’s performance using the Run Benchmark option in DAX Studio.

The Run Benchmark option allows you to customize the number of cold and warm cache executions in your query.

When you click this option, the Benchmark wizard opens. You can specify the number of times you want to run a query in cold cache or warm cache.
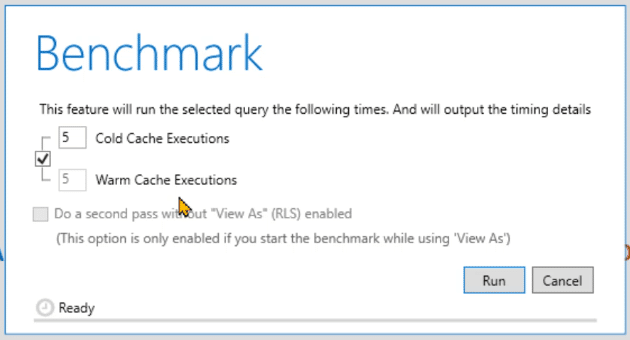
Cold cache means that DAX Studio will first clear the cache and then run the query based on the specified number. On the other hand, warm cache means that DAX Studio won’t clear the cache before running the query.
This tutorial will be using the code below which generates the CallbackDataID:
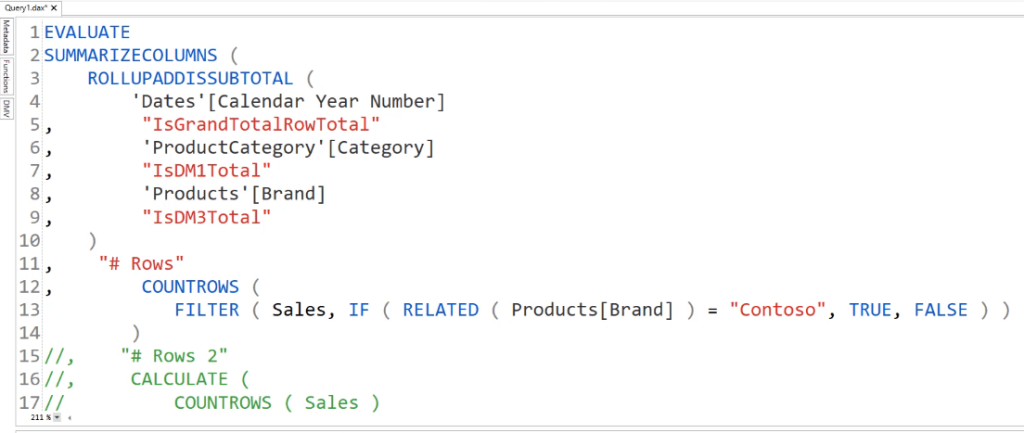
Before using the Run Benchmark option, let’s execute the code and view the Server Timings data.
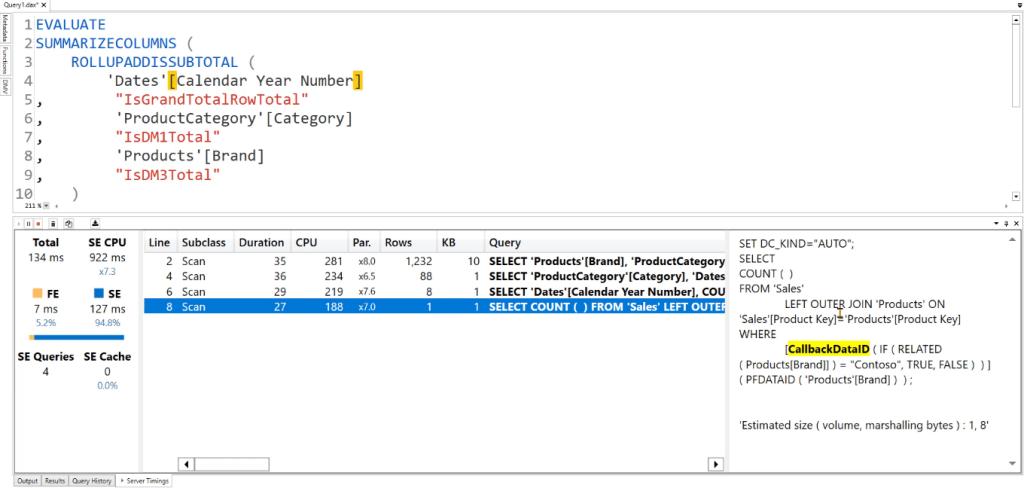
You can see that the code takes 134 milliseconds to execute. It also contains the CallbackDataID.
Using The Run Benchmark Option For DAX Code Performance
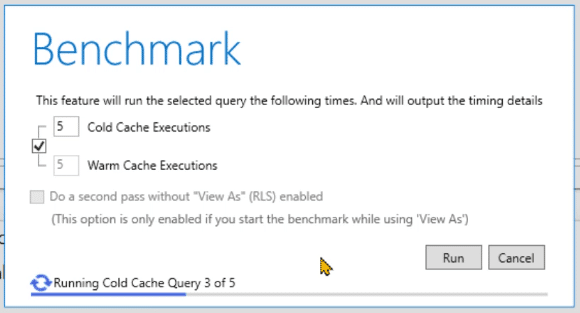
When you click the Run Benchmark option and run the query with 5 cold cache executions, you’ll see a progress bar at the bottom of the Benchmark wizard. It clears the cache and then runs the code five times.
Afterwards, two tabs will open in the Results pane. The first tab, Summary, shows a table with information regarding the Cache type, its Statistic, Total Duration, and SE Duration.
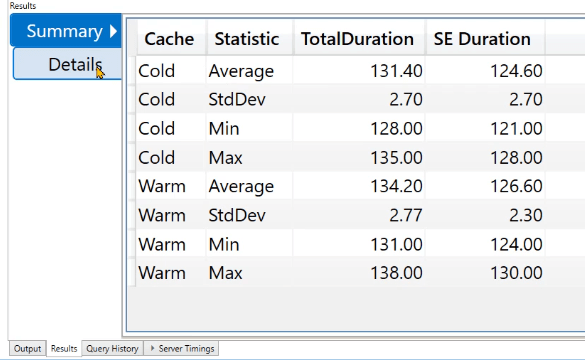
Comparing the data between the cold cache and warm cache, you can see that clearing the cache doesn’t have a significant difference to the run duration.
The second tab, Details, shows more comprehensive information regarding the cache of the DAX query.


Varying Cache Duration
Let’s run a different DAX code to see how it affects the query timing.
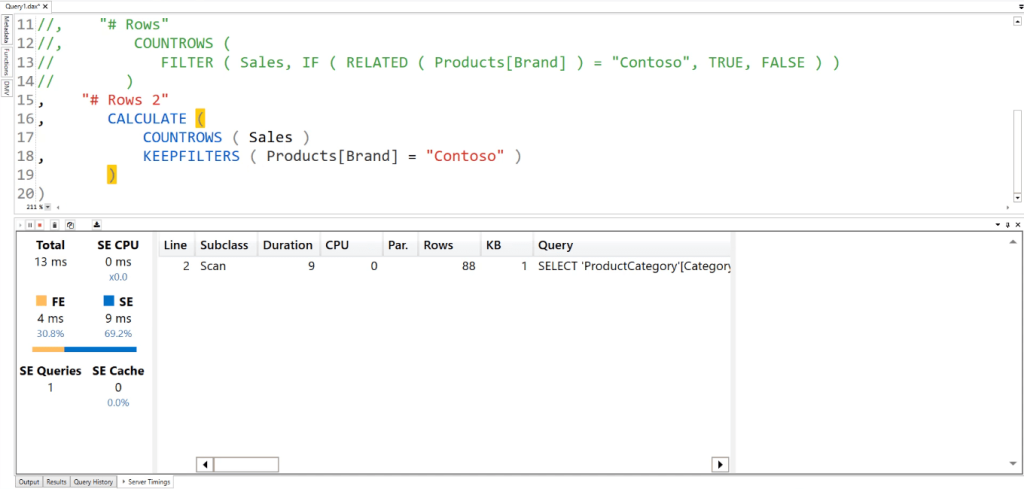
You can see that it only takes 13 milliseconds to clear the cache and execute the code.
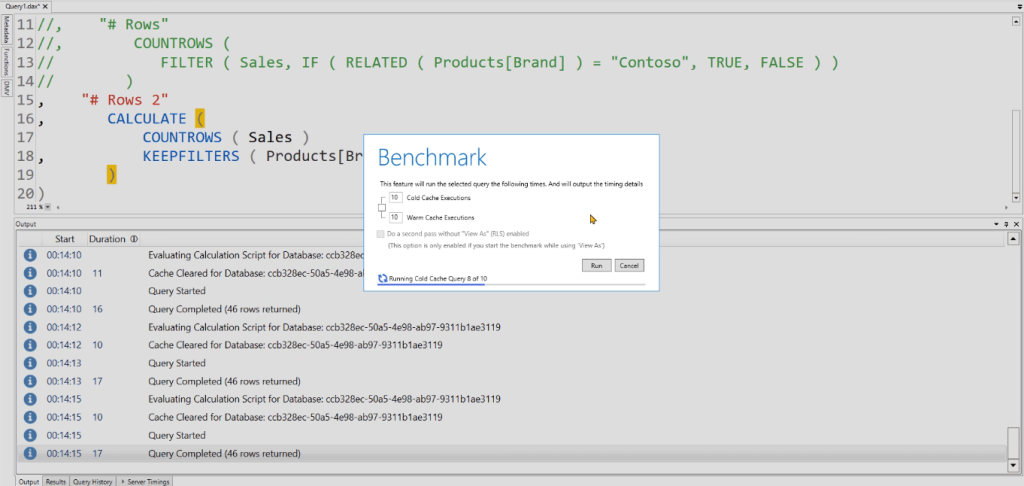
Next, click the Run Benchmark option. Uncheck the box and perform 10 executions for both the cold and warm cache.
In the results pane, you can see that it takes 12.8 milliseconds to run in cold cache and 3.9 milliseconds to run in warm cache.
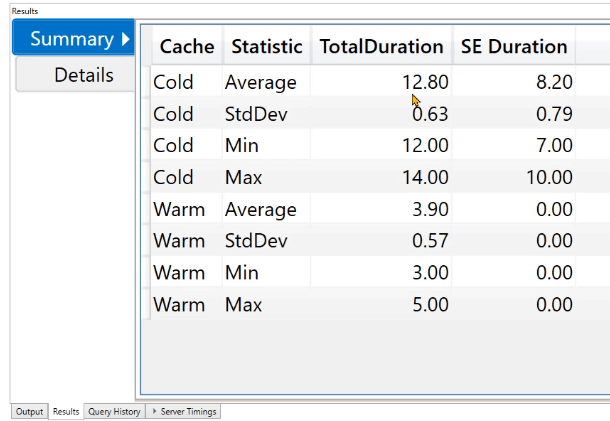
The storage engine duration isn’t measurable in warm cache because the queries are answered from the data cache itself.
In the Details tab, you can see that there’s a total of 20 executions; 10 in cold and 10 in warm. The cold duration is always greater than the warm duration.

Scrolling to the right-most column, you can see that the VertiPaq cache matches contains 0 for cold cache and 1 for warm cache.
Comparing DAX Code Performance Using Graphs
To get more insightful data, you can create a line graph out of the results from the Benchmark option. You can create a comparison using intervals of 10. That is, you run the benchmark using 10, 20, 30, and so on for both the cold and warm cache. This will help you understand how much time a query takes to execute based on the MIN, MAX, and AVERAGE.
You can also start with a small database and gradually run the code of a more complex database. Then create a line graph to see the performance of the code.
This makes it easier to identify if the duration increased or decreased with respect to the number of rows in your DAX query.
***** Related Links *****
Power BI Compression Techniques In DAX Studio
Storage Engine – Its Role In Optimizing DAX Queries In Power BI
Storage Engine In Power BI – VertiPaq Operators & Queries
Conclusion
Optimizing your DAX code’s performance is important. A 0.5 millisecond difference per row of code may not mean much. But once you’re dealing with multiple rows of code that produce a million rows as a result, this 0.5ms will make a great difference.
Using the Run Benchmark option allows you to gather the time data of your code. You can use this to make comparisons between different rows of code. You can also use this to gain meaningful insights as to what part of your DAX code needs to be optimized.
Enterprise DNA Experts

Be the first to comment