

From the Desk of Ian Culley @IanCulley
I’m not concerned with last year’s winners heading into 2024.
Winners have a miraculous way of taking care of themselves (i.e. cattle, sugar, cocoa.)
Instead, my focus centers on those markets that failed to launch. Markets like this…
No, I’m not talking about Gold. But it certainly fits the bill.
I’m referring to wheat.
Wheat never produced an explosive rally this year – at least nothing like we saw in 2022. But that could all change in the coming six months.
Check out Chicago wheat futures carving out a potential double-bottom pattern:
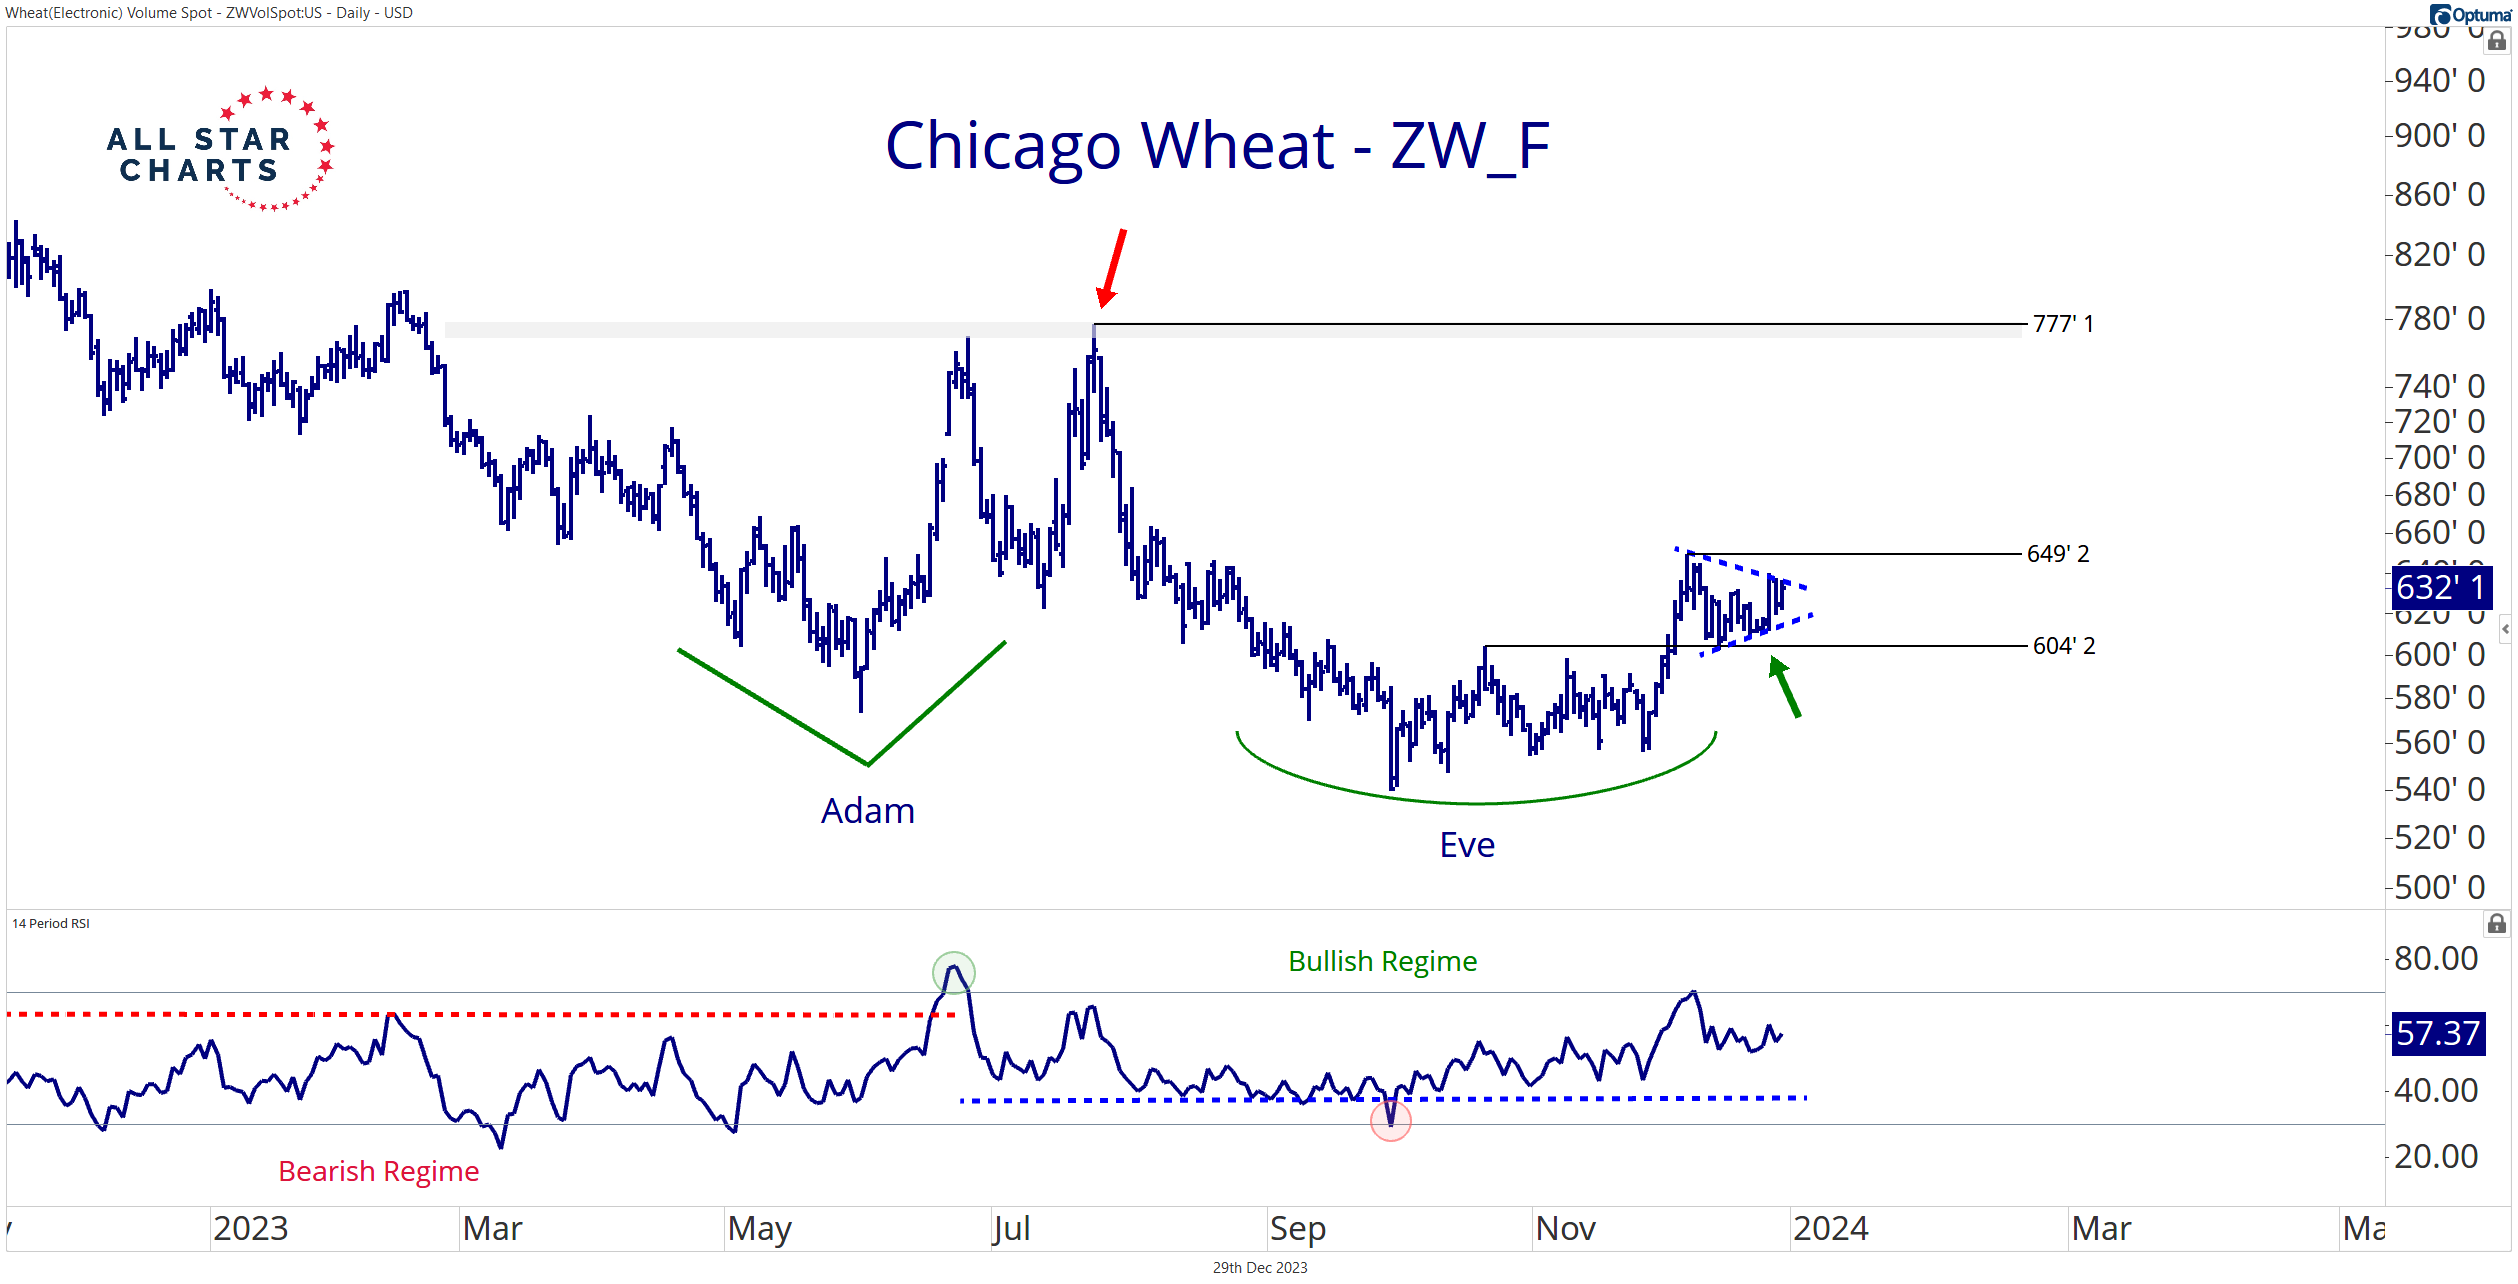
Wheat futures are taking the shape of a classic Adam and Eve formation – a sharp sell-off followed by a longer accumulation period.
In addition, the 14-day RSI completed a bearish to bullish reversal last summer. Trend reversals in momentum such as this often lead price reversals.
Most importantly, buyers are driving prices higher, defending the former pivot highs at approximately 600’0.
That’s our line in the sand. As long as Chicago wheat holds above that level, our initial target of 775’0 is in play.
If you’re not already long Chicago wheat, waiting to buy strength above 650’0 is a viable entry signal as it coincides with the completion of a bull flag.
I always like to have a secondary objective, especially for commodity markets.
Zooming out on the weekly chart, the 840’0 area marks a logical target.
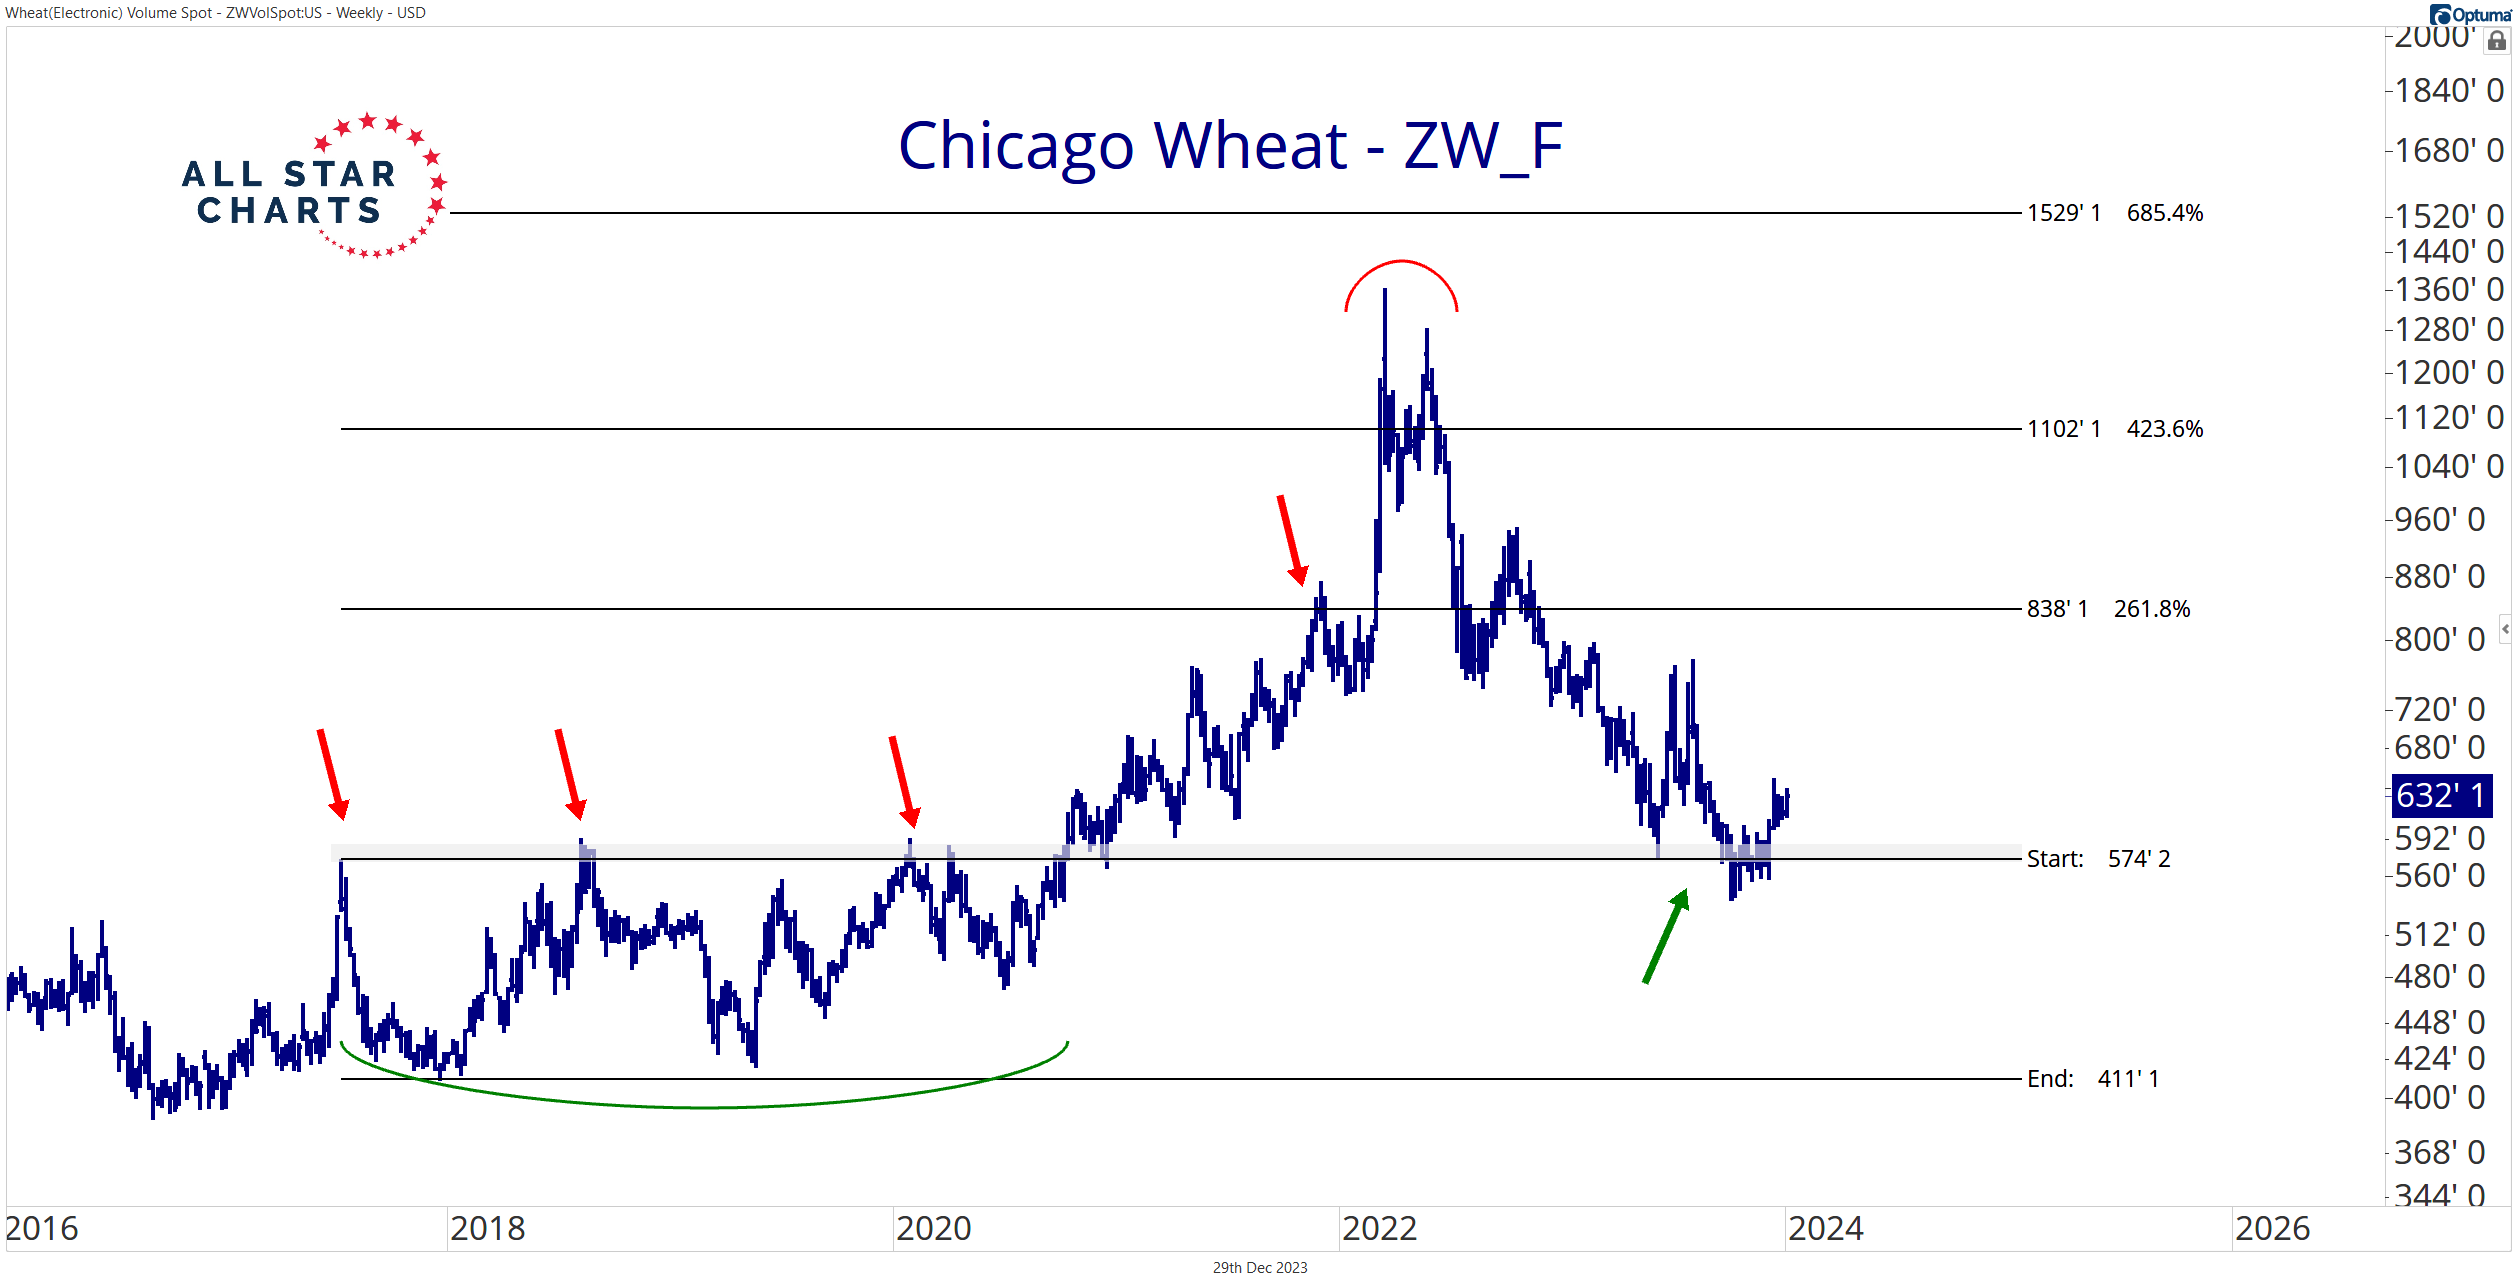
Knowing grain markets, wheat could rip above 1100’0 toward a new all-time high by July.
Nevertheless, I’m tracking our risk level and more modest upside objectives until the market suggests otherwise.
That’s it for today. Keep wheat on your radar!
Next week, I’ll outline more of my favorite commodity markets for 2024.
Stay tuned, and Happy New Year.
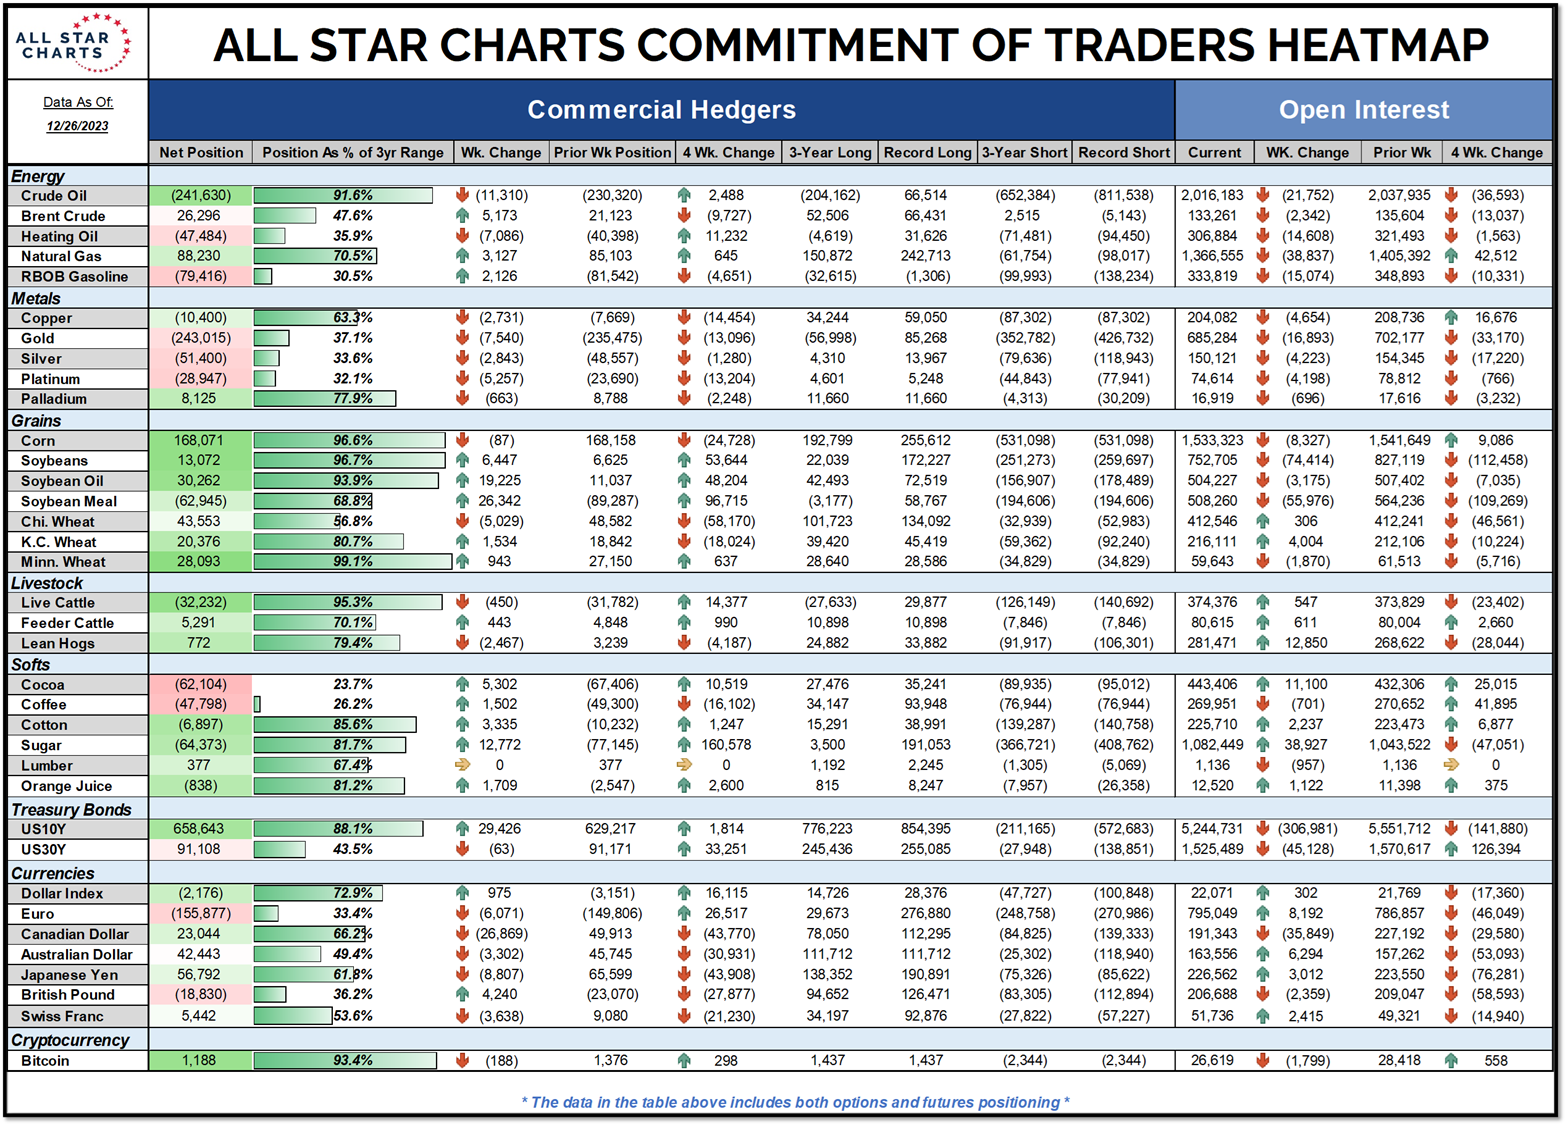
COT Heatmap Highlights
- Commercial hedgers scramble to buy soybean oil as they added almost 20,000 contracts this week.
- Commercials hold within five percent of their smallest net-short position for live cattle in three years.
- And commercials pull within one percent of a three-year record-long position in Minneapolis spring wheat.
Click here to download the All Star Charts COT Heatmap.
Premium Members can log in to access our Weekly Commodities Report Chartbook and the Trade of the Week. Please log in or start your risk-free 30-day trial today.
Be the first to comment