

<table> :
Any DAX expression that returns a table of data.
<groupBy_columnName> :
The name of an existing column in the table (or in a related table,) by which the data is to be grouped. This parameter cannot be an expression.
<name> :
The name given to a new column that is being added to the list of GroupBy columns, enclosed in double quotes.
<expression> :
Any DAX expression that returns a single scalar value, where the expression is to be evaluated for each set of GroupBy values.
Note:
The expression used in GroupBy may include any of the “X” aggregation functions, such as SUMX, AVERAGEX, MINX, MAXX, etc. and when one of these function is used in this way, we allow the table argument (which normally must be a table expression) to be replaced by a special function CURRENTGROUP().
Restrictions on expression:
The CALCULATE function (and therefore measures) are not allowed in the expression.
The CURRENTGROUP function may only be used at the top level of table scans in the expression. That is, SUMX(<table>,SUMX(CURRENTGROUP(…), …)) is not allowed.
ABS( SUMX(CURRENTGROUP(), [Column] ) ) is allowed, since ABS does not perform a scan.
Scenario :
Suppose we have a Data Model in our Power BI Report as follows..
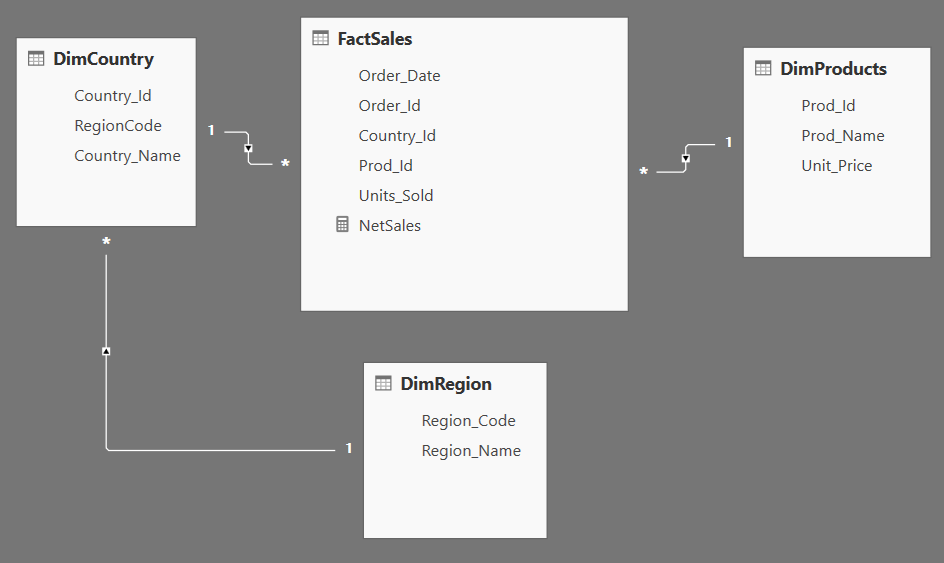
From the above Model, we can see the NetSales by Country and Product Name as follows..

Note :
In the above table, the Measure [NetSales] is calculated using the below DAX Expression.
NetSales = SUMX(FactSales,FactSales[Units_Sold]*RELATED(DimProducts[Unit_Price]))
Calculated Table with use of GROUPBY() and CURRENTGROUP() Functions :
Now we can create a Calculated Table to show NetSales that GroupBy Country and Product using below DAX Expression using the GROUPBY() and CURRENTGROUP() Functions.
SalesByCountryByProduct =
GROUPBY (FactSales, DimCountry[Country_Name], DimProducts[Prod_Name],
“GroupBySales”, SUMX(CURRENTGROUP(),FactSales[Units_Sold]*RELATED(DimProducts[Unit_Price])))
Result :


In the similar way, we can create a Calculated Table that shows the Max Sales by Country, from the data that is already grouped by Country and Product, as follows..
HighSalesByCountry =
VAR vGroupSales=GROUPBY (FactSales, DimCountry[Country_Name],DimProducts[Prod_Name], “GroupBySales”,
SUMX(CURRENTGROUP(), FactSales[Units_Sold]*RELATED(DimProducts[Unit_Price])))
RETURN
GROUPBY(vGroupSales, DimCountry[Country_Name],“MaxSalesByCountry”,
MAXX(CURRENTGROUP(),[GroupBySales]))
Notes :
First we are grouping the data by Country and Product, then we are storing that data in the Variable “vGroupSales”.
Next again we are grouping the data of the “vGroupSales” by Country then we are finding the Max Sales by Country.
Result:


Be the first to comment