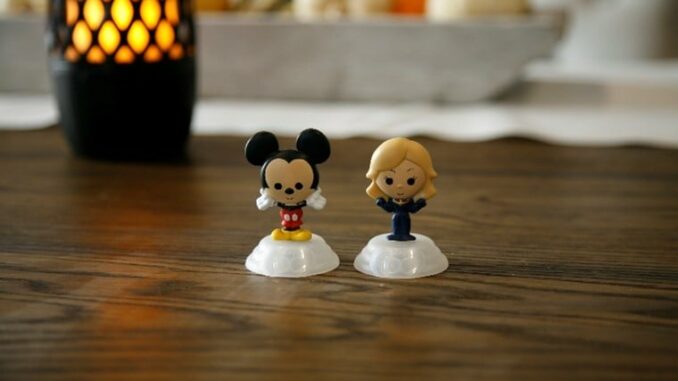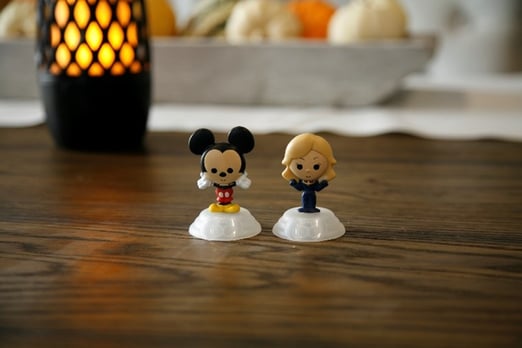
This month, Disney and McDonald’s, two of my favorite brands, have partnered together for a fun promotion. To celebrate the 100th anniversary of the Disney corporation, McDonald’s is offering a Disney 100 Happy Meal! Each Happy Meal box contains two small plastic figurines of Disney favorites, including classic Disney, Pixar, Marvel, and Star Wars. Word on the street has it that there are 62 figurines in total, and they are a hot ticket item. I must have them, and being a statistician, I am going to gather data and use data analysis to calculate the probability that I can get them all!
But full disclosure… despite my solid knowledge of data-driven problem solving, I made my share of mistakes in the data collection process, and I would like to share some lessons learned.
Lesson 1: Create a Data Collection Plan
I was so excited about this project that I began collecting data before doing any preliminary research, project planning, or strategizing. Given that these toys are only available for a limited time, that was a mistake. In fact, not enough pre-planning is probably the biggest obstacle to achieving my goal of collecting all 62 figurines in the short time remaining.
That said, my first data point was successful. In row 1 of my Minitab worksheet, you will see that I scored big with obtaining the coveted Mickey Mouse and Captain Marvel combination:


The figurines were cute, so I decided it was worth continuing my quest. But my local McDonald’s won’t sell just the toy. You can only get it in the Happy Meal and as much as I love their Chicken McNuggets, even I can only eat so many of them. I really should have thought more about how to get the results I needed with a minimum number of runs, or restaurant runs so to speak.
Lesson 2: Brainstorm Potential Roadblocks
The next day I headed back to my favorite McDonald’s location to collect row 2 of my Minitab worksheet and…

Epic fail! I already have the Mickey Mouse/Captain Marvel combo. I now realize I have a binary outcome variable. Each restaurant run will result in a success, where I obtain two figurines that I don’t already have, or a failure where that doesn’t happen.
I try to learn from my failures, and this was a reminder of something I already knew:
Never start collecting data without brainstorming around what results you might see, what problems could arise when collecting data, and how you will address these issues. Minitab Workspace has some great brainstorming tools for this.
Also, ask questions, lots of questions.
My second data point did lead me to ask these questions…
-
Are the combinations always the same? For example, will Mickey always be paired with Captain Marvel? It turns out that the answer to this question is Yes. This is a key piece of information since it means I only need 31 unique boxes to obtain all 62 characters.
-
How does the distribution work? I learned that each McDonald’s is given random boxes of these figurines, but each box that they receive contains only one of the 31 combinations of characters. Restaurants are also required to deplete their inventory of one box before they can start distributing the characters from the next box. This explains why row two was a duplicate. This restaurant hadn’t gone through their entire supply of the Mickey Mouse/Captain Marvel pair yet.
Lesson 3: Consider All Factors that Might Affect the Outcome
My strategy for my 3rd row 3 of data was to choose a different restaurant location for a better chance of getting a character combination that I didn’t already have. So, day 3, I head north instead of south and…

The figurines were not available, which brings up a new set of questions:
- Was the missing toy at Restaurant B because I was too late? (I went to lunch late that day.)
- Is there something disrupting their supply chain?
- Or is something else at play?
I realize I may have missed an important factor – time of day.
Lesson 4: A carefully designed experiment will save you time and runs in the long run
To possibly get a handle on the time effect, I decided to try Restaurant B again, but a few hours earlier. I also wanted to head back to Restaurant A, even though it adds an additional restaurant run. My hope is that this will provide a little more information about how quickly these two locations are moving through their inventory. (I tried to ask them directly, but they wouldn’t disclose this information.)
So, here are rows 4 and 5:

Another failure at Restaurant B, but fortunately followed by a success!
While I have learned from my haphazard methodology, I’ve only received limited information about the Restaurant factor in my five rows of data. And I still don’t know whether there is a time-of-day effect because I’ve only been collecting my data at lunchtime. As I ponder the necessity of adding dinner to the mix, I realize that a better approach would have been to use a replicated 2-factor, 4-run designed experiment for this. If I had done this, Minitab would have put a data collection strategy in place for me in the form of a randomized experimental design.
But at this point, I’ve already used 5 restaurant runs and I need to course correct.
- There seems to be a location effect, however one location is not giving me useful results because no toy was available both times I went. I need to add at least one more restaurant to the mix. (Given the way toys are distributed, more restaurants would be even better, but it may not be worth the extra time and money.)
- If a restaurant has the potential of running out of inventory later in the day, could I test this hypothesis by collecting dinner-time data? Given the potential for duplicates, should I spread out visits to the same location?
- It has taken four days and five runs to yield 2 of the 32 possible figurine combos. Given that this promo ends this week, I need to either start eating a lot more happy meals or recruit help from friends. (Preferably friends that live near McDonald’s locations different than mine.)
Conclusions
My data now stands at 4 successes and 3 failures. I have moved to twice daily data collection and added a new restaurant to the mix with great success.
.jpg?width=600&height=275&name=Picture5%20(1).jpg)
Data-driven problem solving does not always need to involve complicated statistical tools. And it is always better to step back and plan before collecting that first row of data. But even imperfectly collected data is probably better than no data at all.
Oh, and let me know if you have any duplicate happy meal toys that you are willing to share.


Be the first to comment