

From the Desk of Ian Culley @IanCulley
Each commodity market has unique supply and demand dynamics.
The result: A diverse set of assets offering a steady flow of trading opportunities.
Today, I’ll outline two promising trade setups – one long, one short.
Let’s start with a fan favorite…
Natty Gas!
Natural gas futures gained over 6% yesterday, taking out a key pivot high.
Here’s the continuation chart posting its highest level since March:
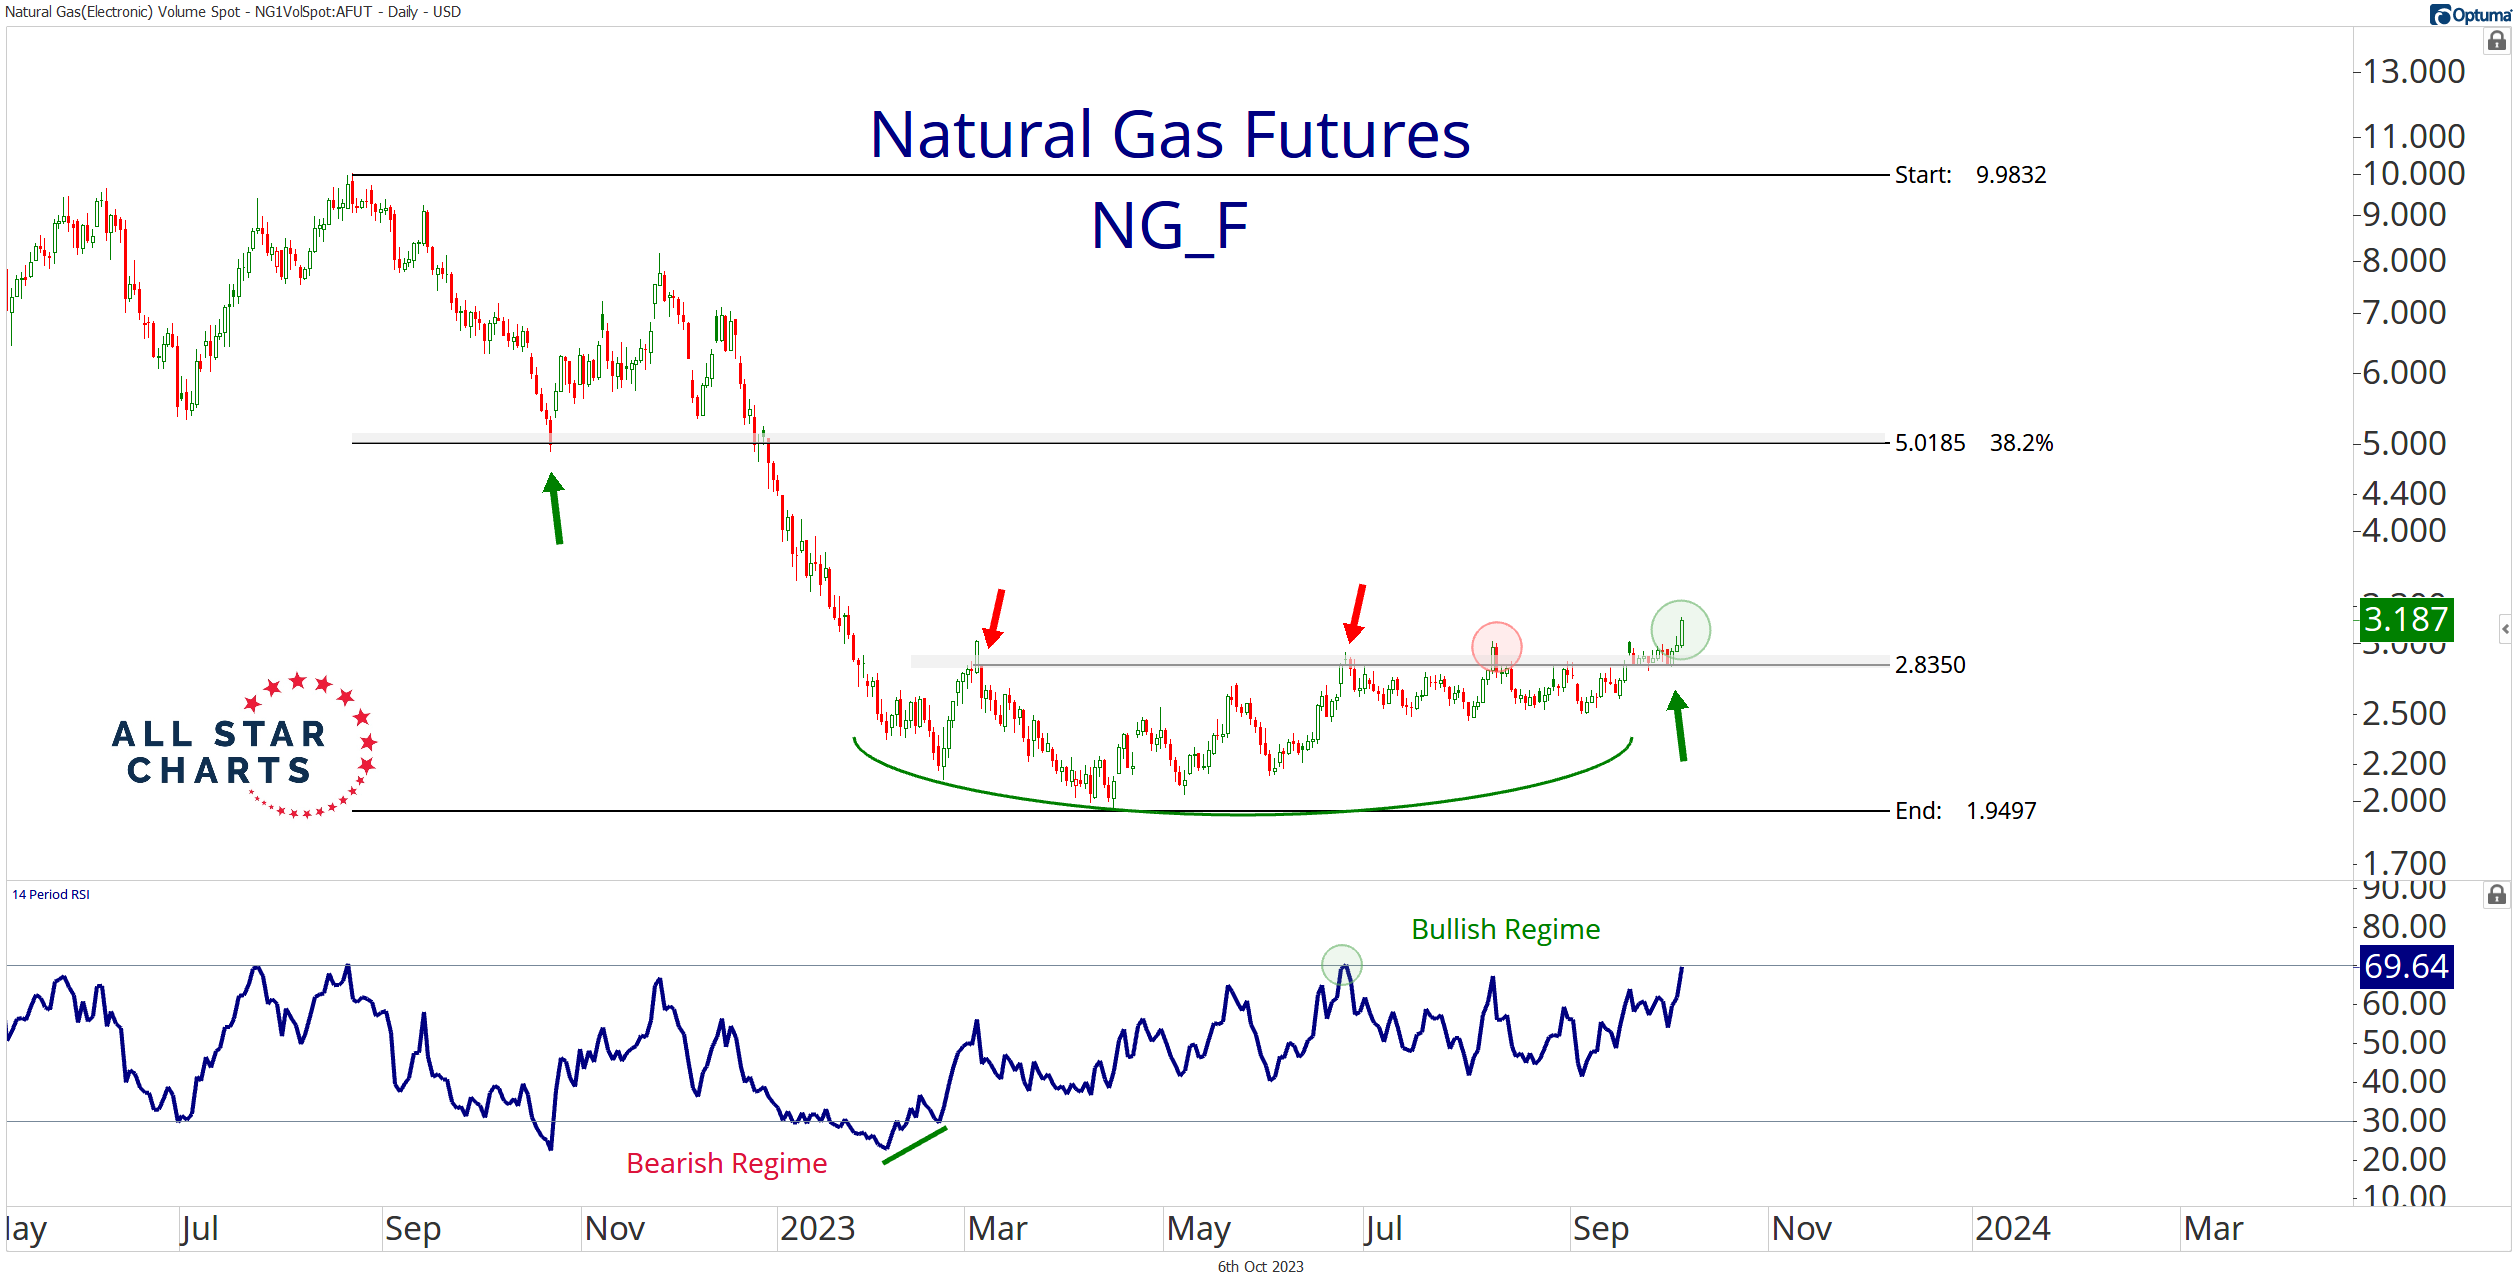
Notice natty gas is finding support above a former resistance zone at roughly 2.835.
On Wednesday’s What the FICC? I mentioned trading against Tuesday’s low based on this near-term support.
Price has ripped higher since, taking out a shelf of pivot highs and filling a downside gap from early September.
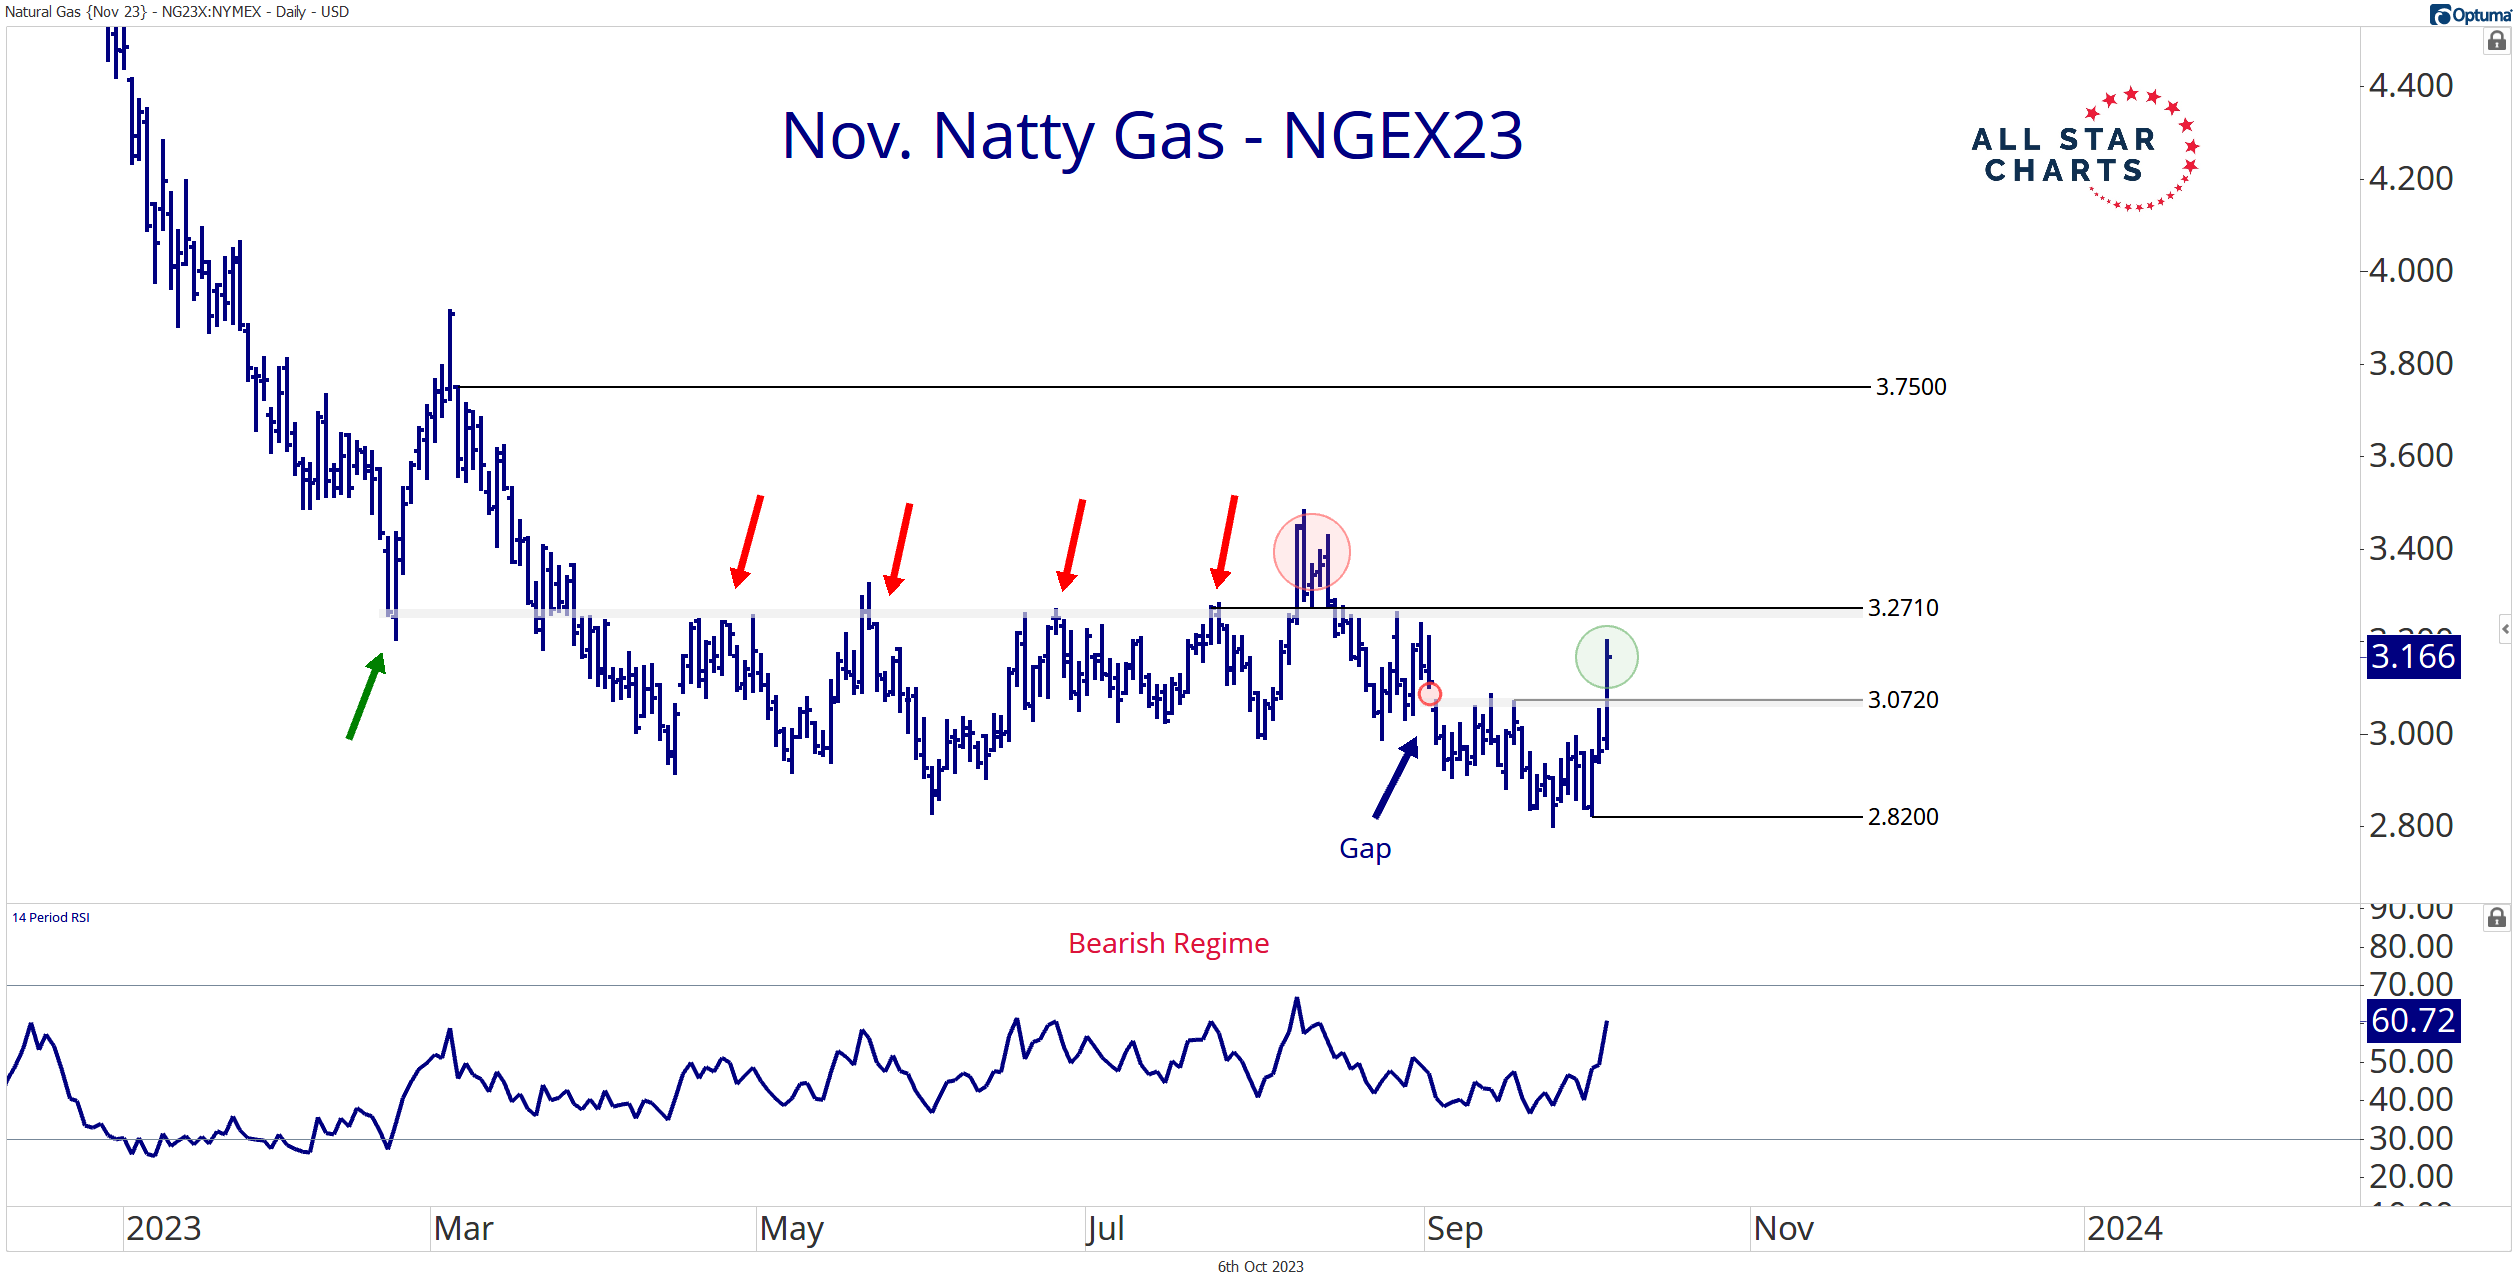
I’m now long the November contract with an initial target of 3.75 and a secondary objective of 5.00.
But I expect more chop in the coming weeks as buyers absorb supply at approximately 3.27. I’ll keep a wide stop until a decisive break above the shelf of former highs.
I view yesterday’s rally as a momentum thrust and the start of a significant uptrend.
Nevertheless, a new contract low places me on the sideline as risk management always trumps conviction.
While Natty gas has been down and out, cocoa has been hot!
Cocoa has gained more than 32% year-to-date, retesting its 2011 high.
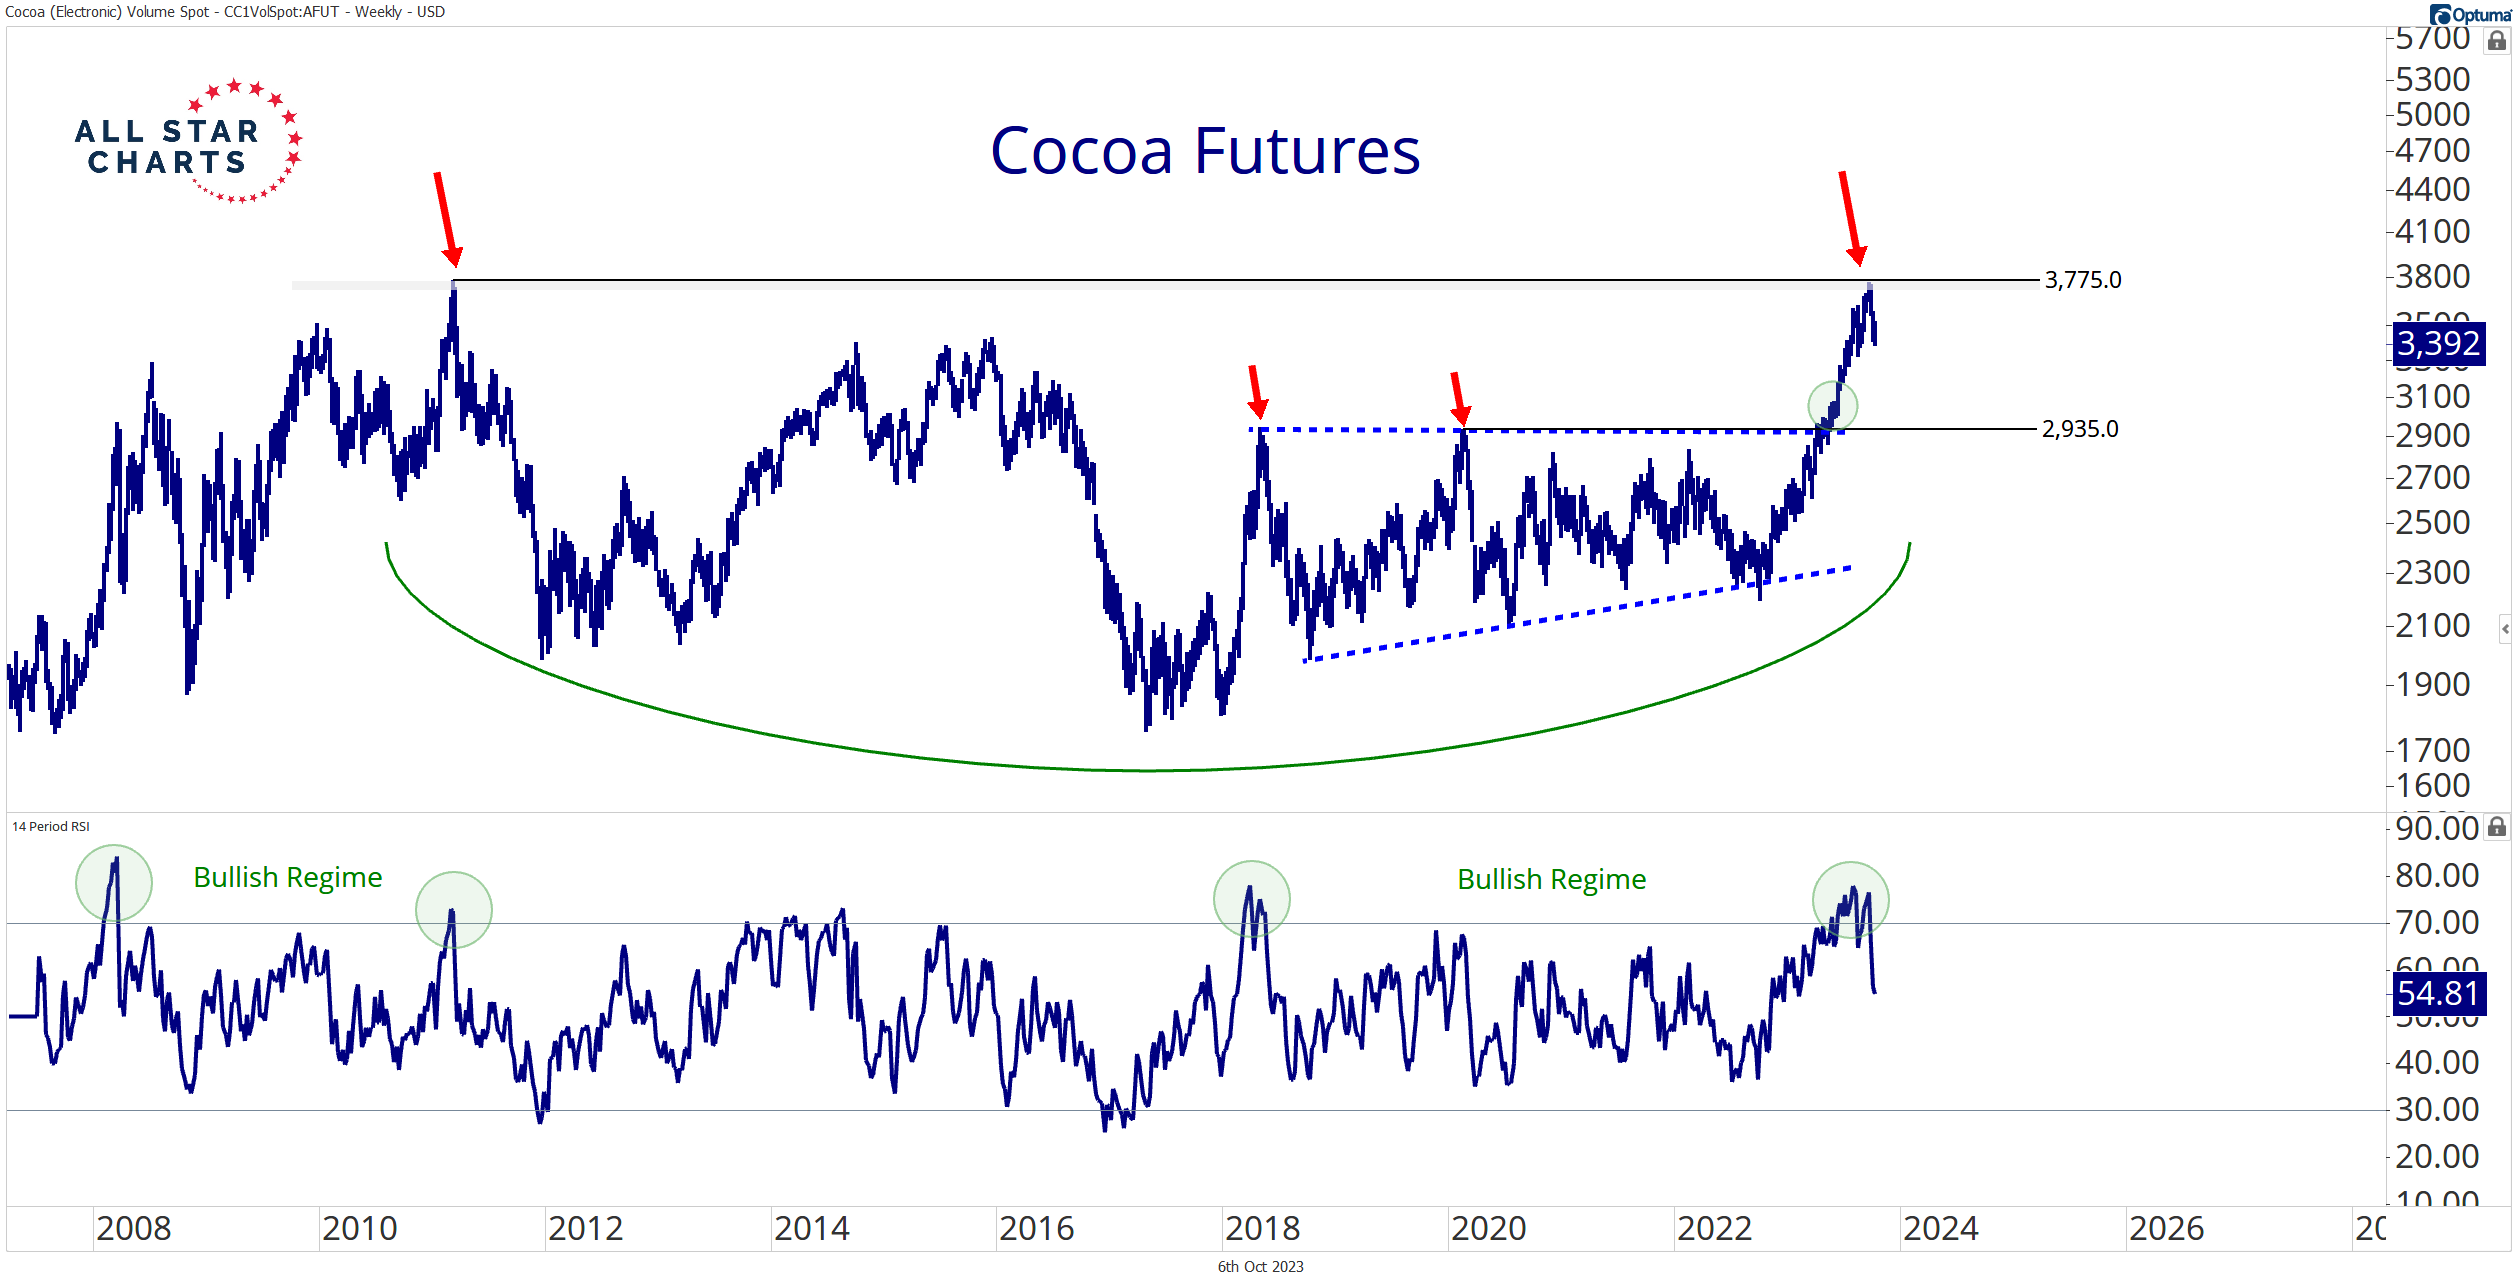
Fresh decade highs are certainly bullish in my book. But the former 2011 high also represents a logical place for this explosive rally to pause – which is exactly what’s happening
Cocoa futures continue to hold above a yearlong trend line. But demand for cocoa is dwindling.
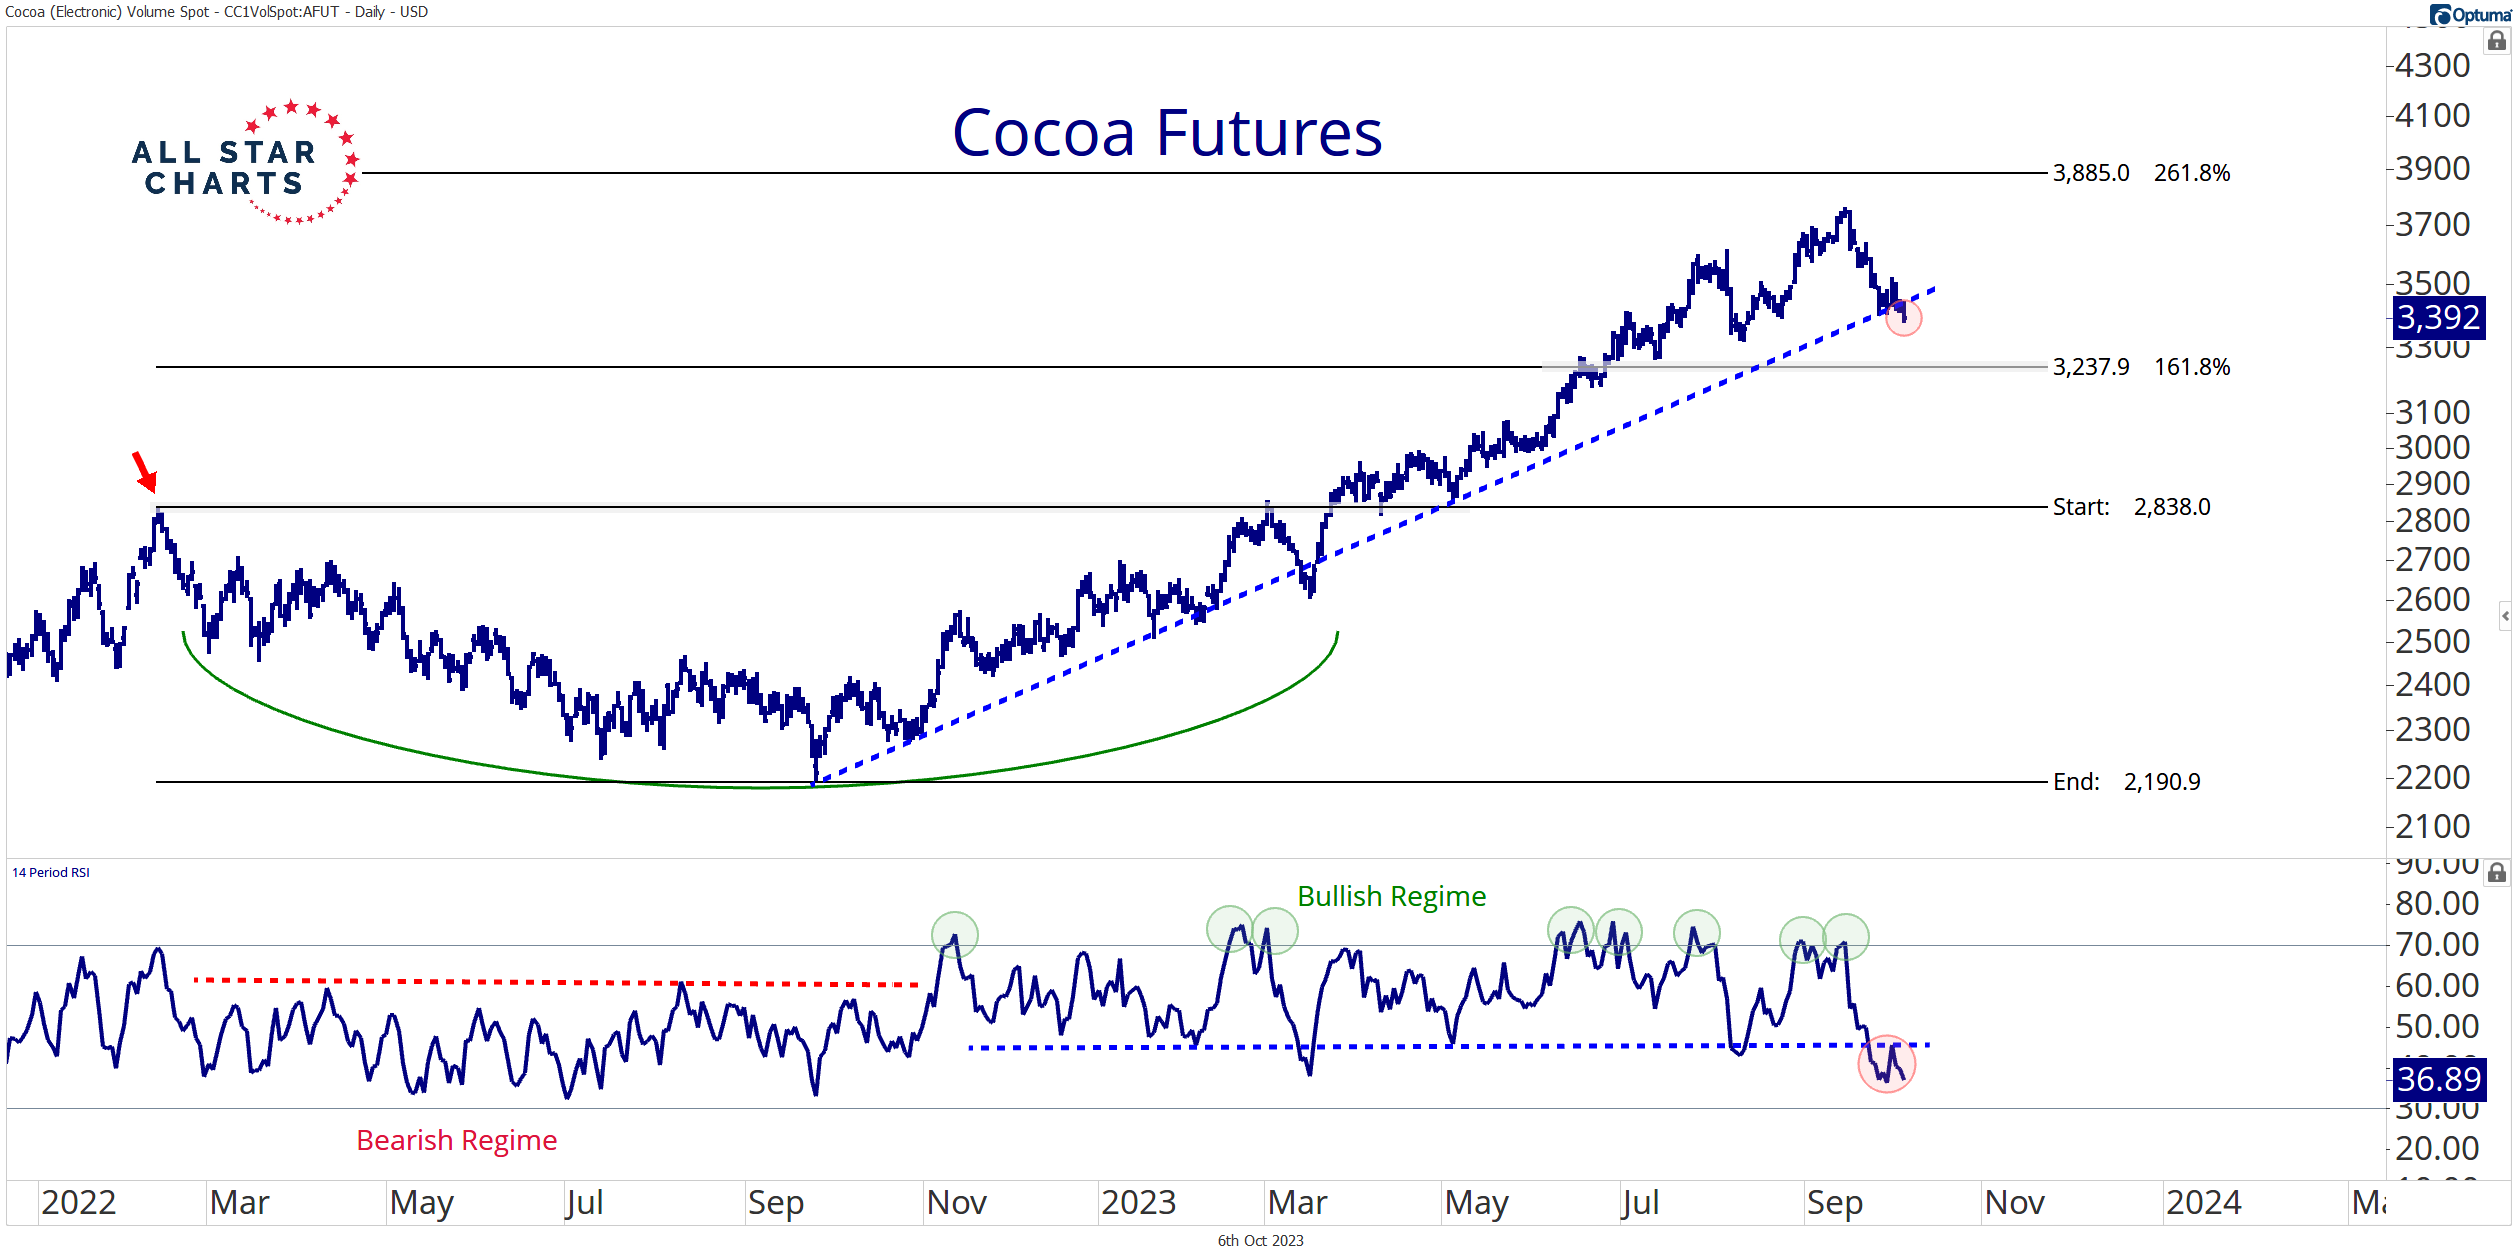
The 14-day RSI has slipped out of a bullish momentum regime, registering its lowest level since last fall. Waning momentum suggests a downside break in the coming days.
I imagine we could witness the latter part of the commodity trading adage – escalator up, elevator down – sooner rather than later.
Check out the December contract:
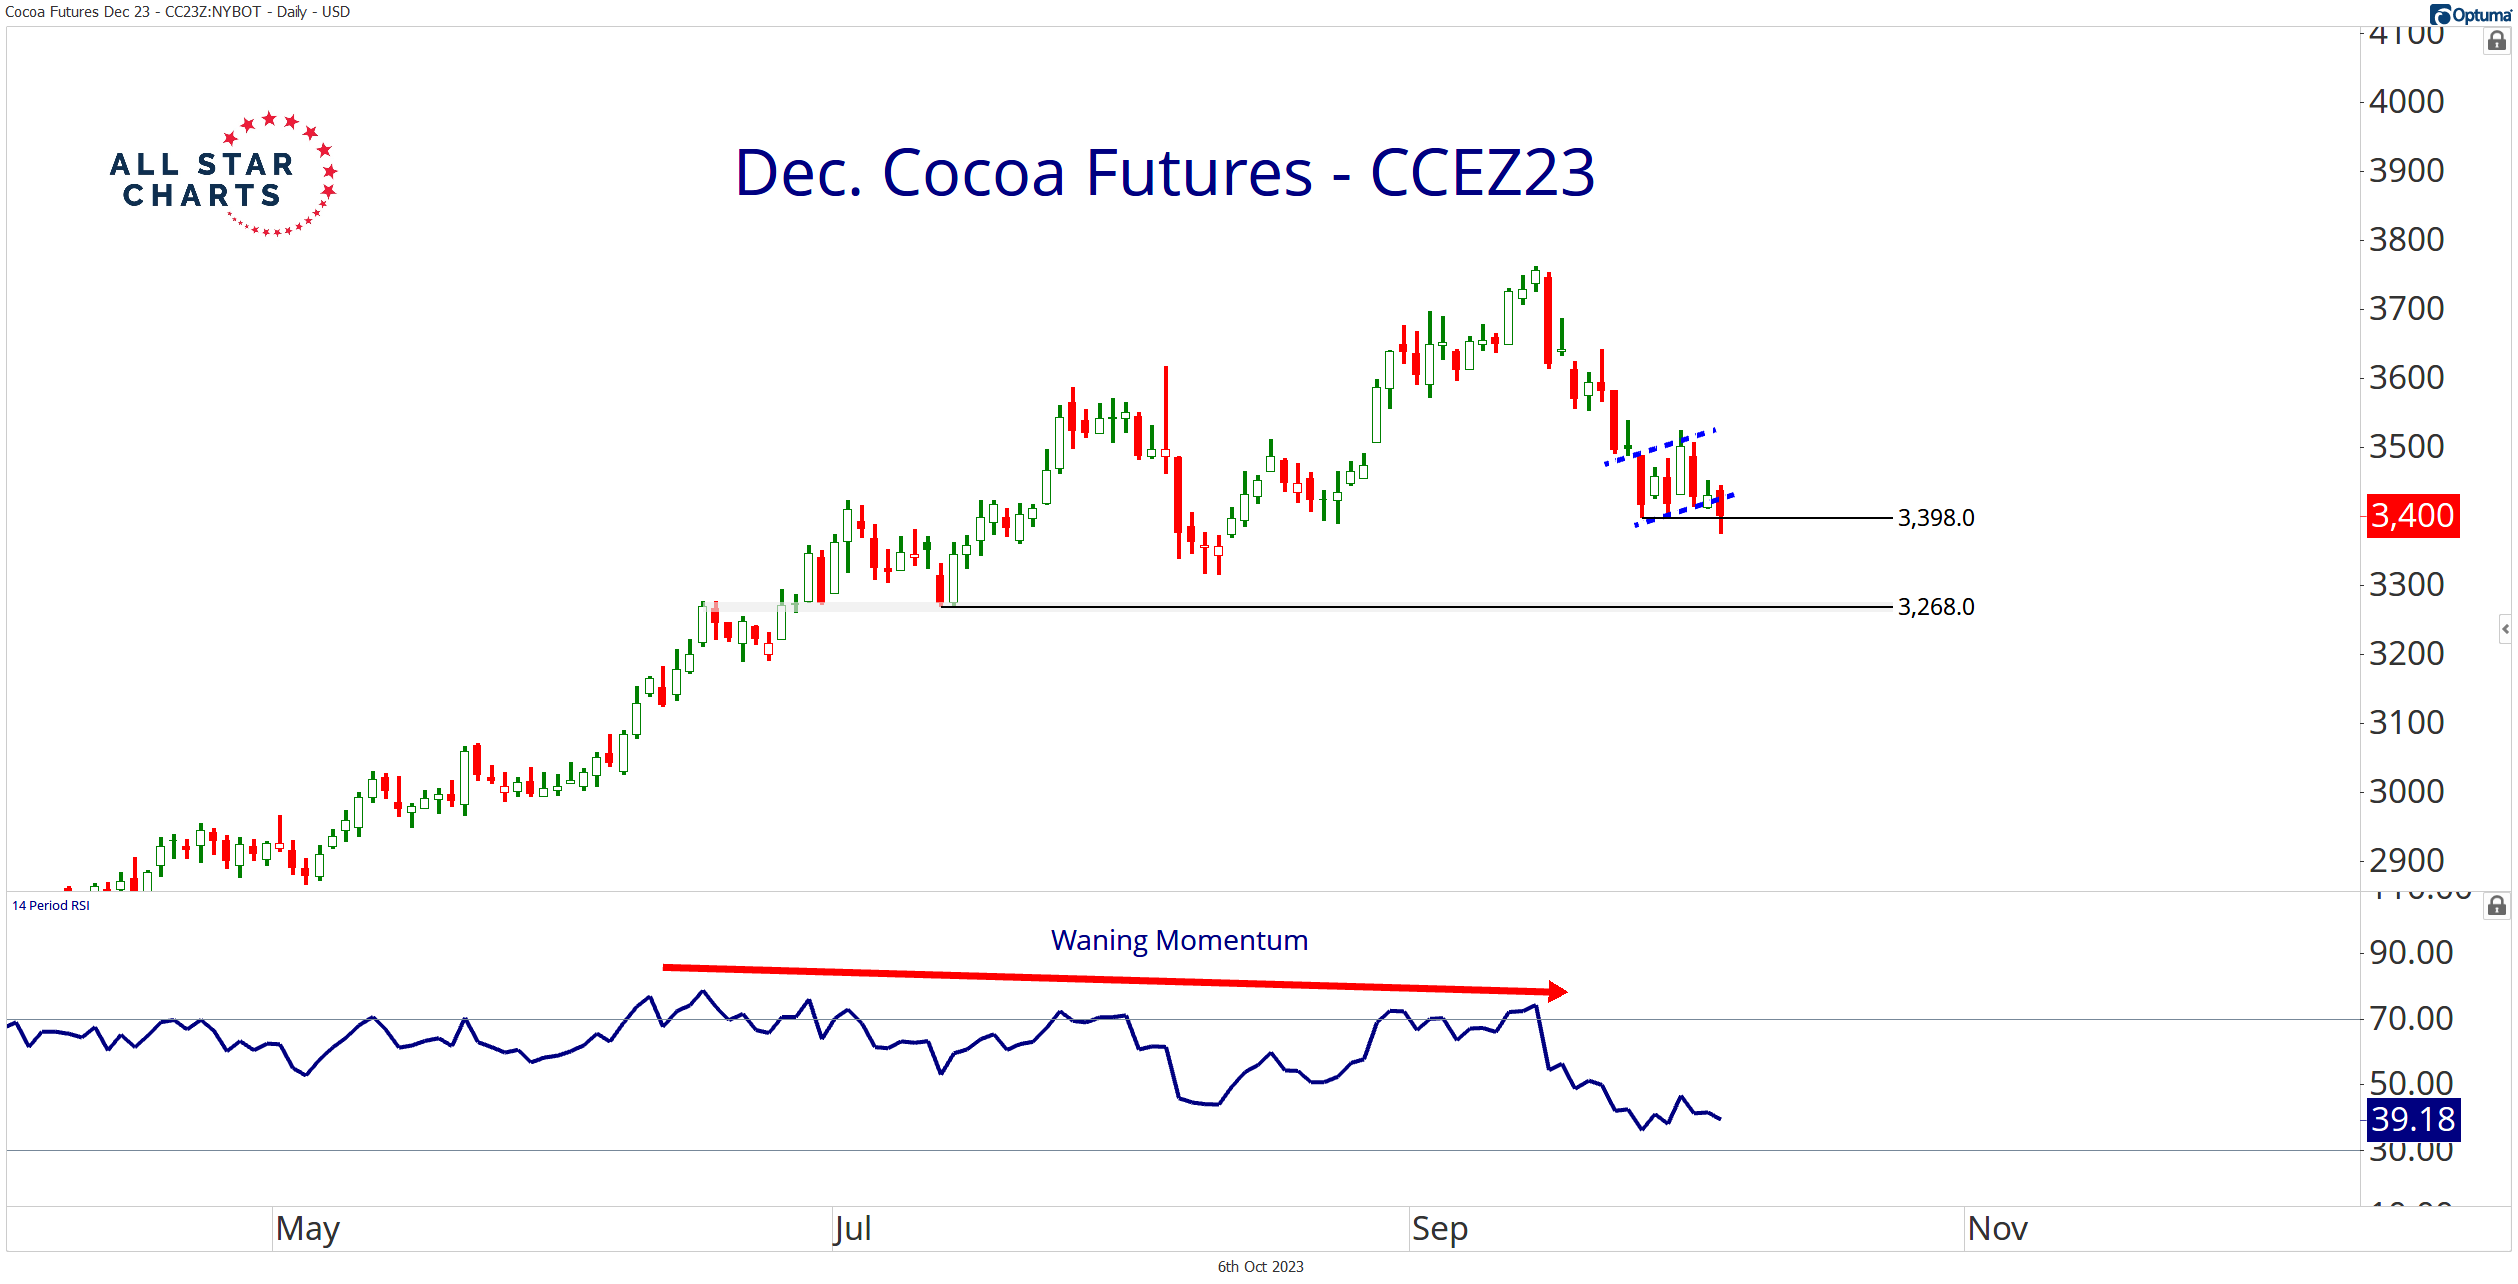
Price is forming a potential bearish flag after dropping almost 10% over the trailing two weeks.
I like swinging at this continuation pattern as it resolves lower.
Plus…
October is historically the worst month of the year for cocoa futures since the early 60’s:
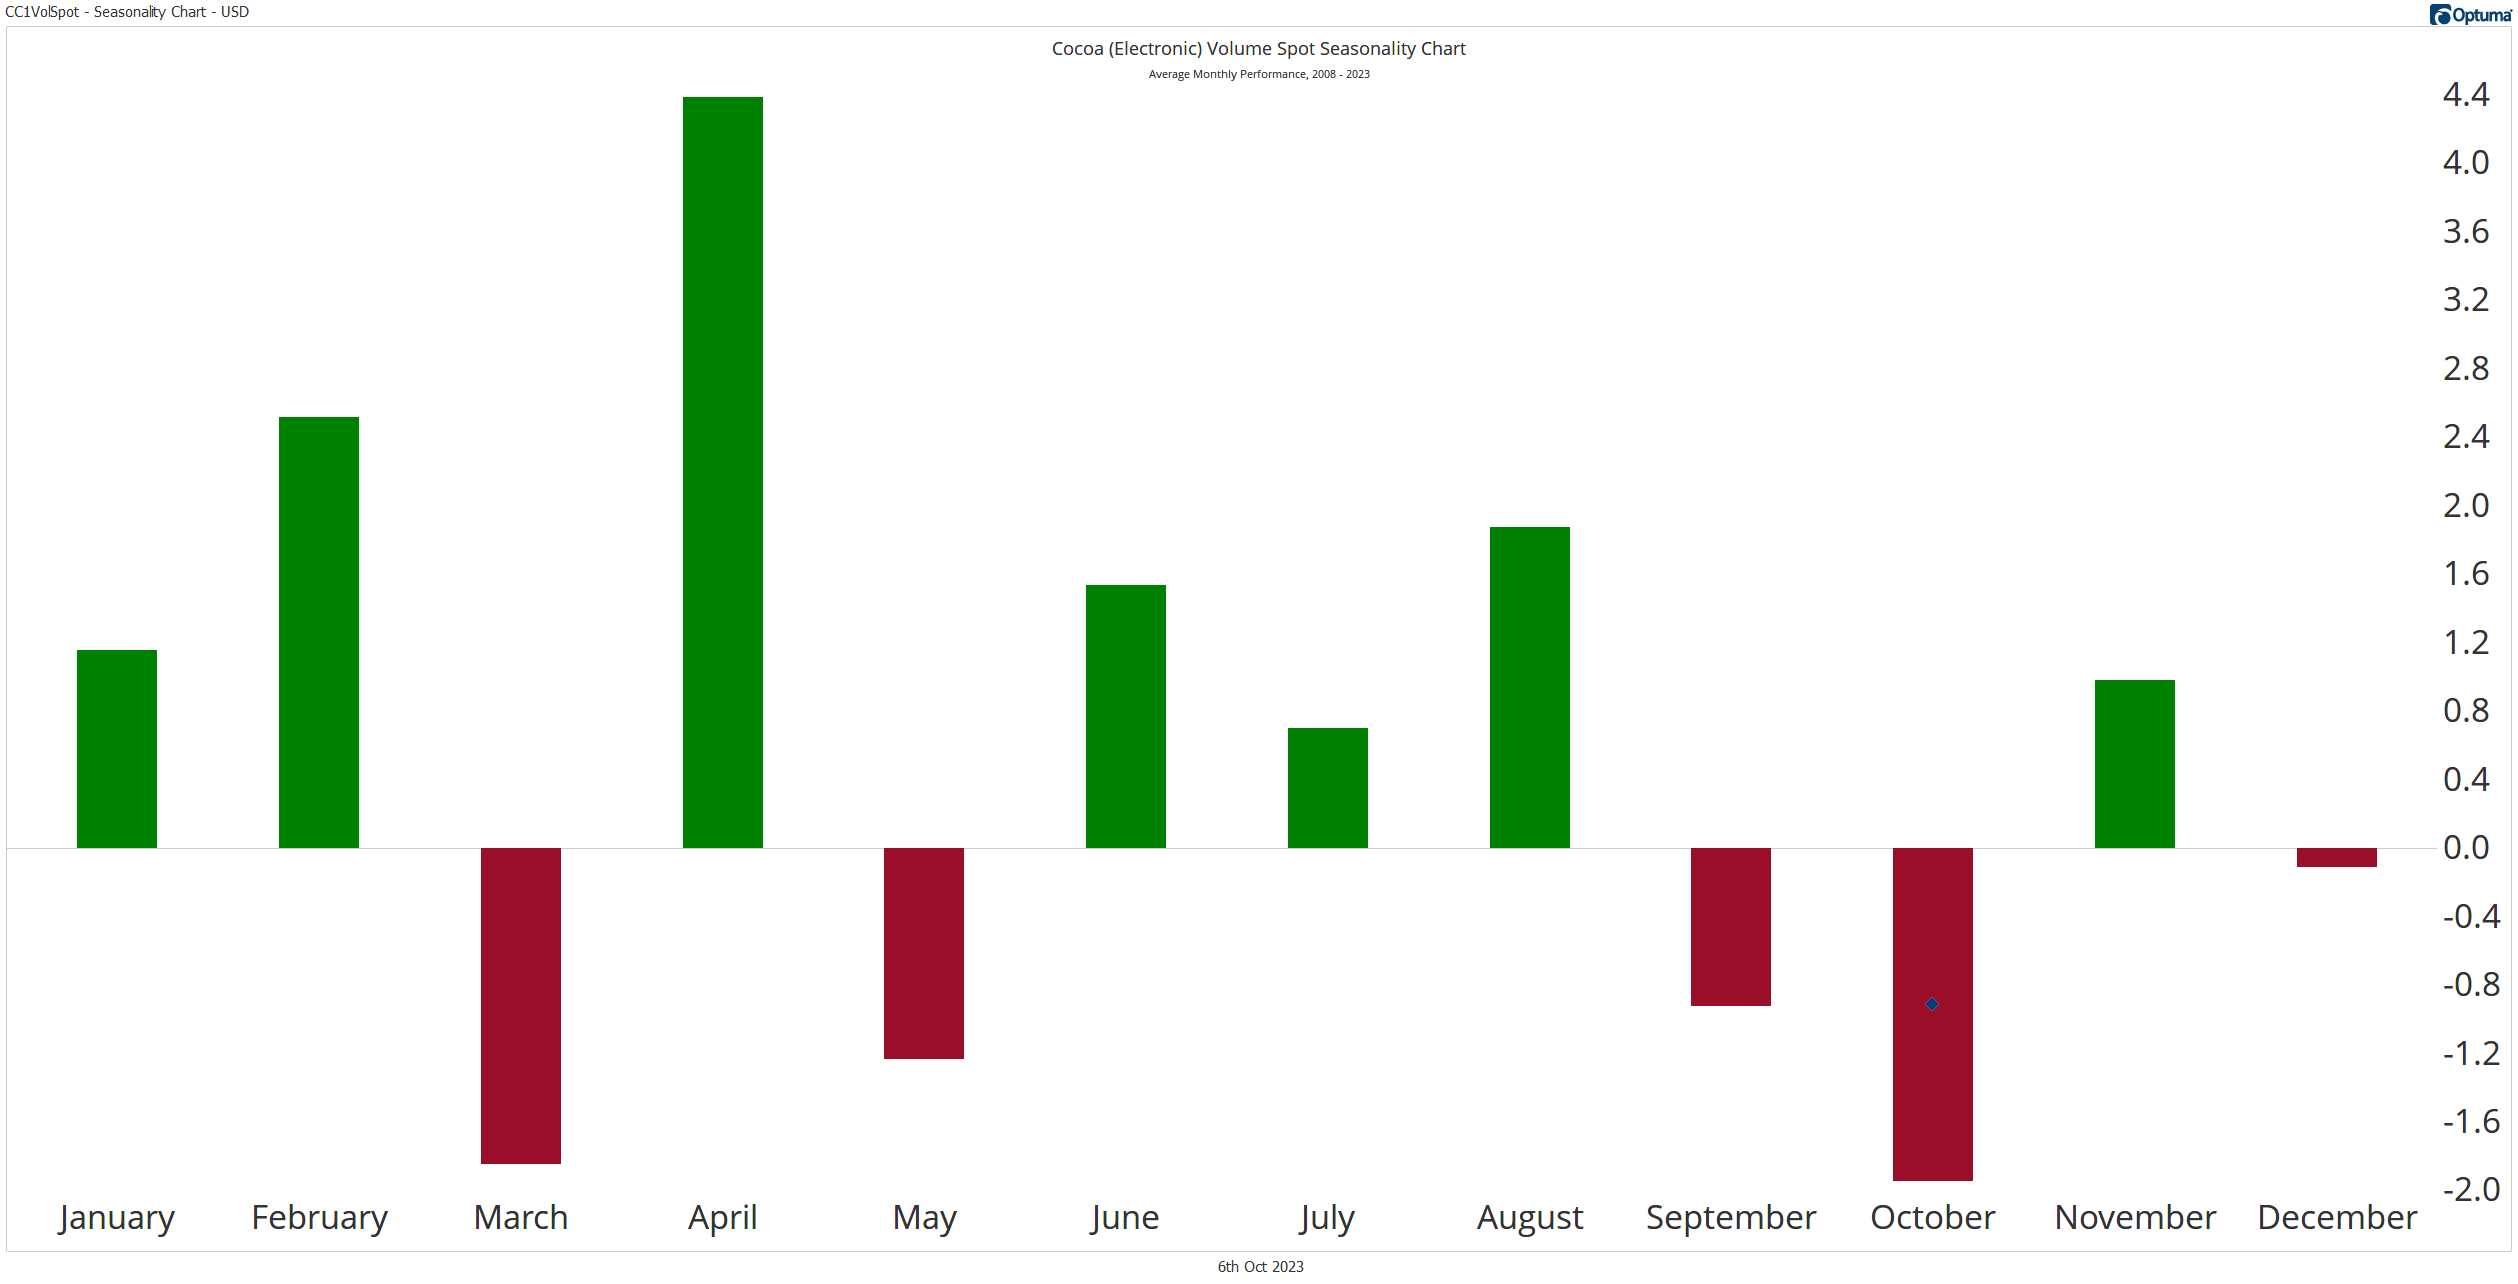
I don’t put too much emphasis on seasonal trends. But I follow patterns.
The October seasonality for cocoa is undoubtedly significant.
I’m short December cocoa futures against 3400, targeting 3250 and 2900.
One more thing…
I took a small long-position in December Chicago wheat at yesterday’s close, as it reclaimed the 570’0 level.
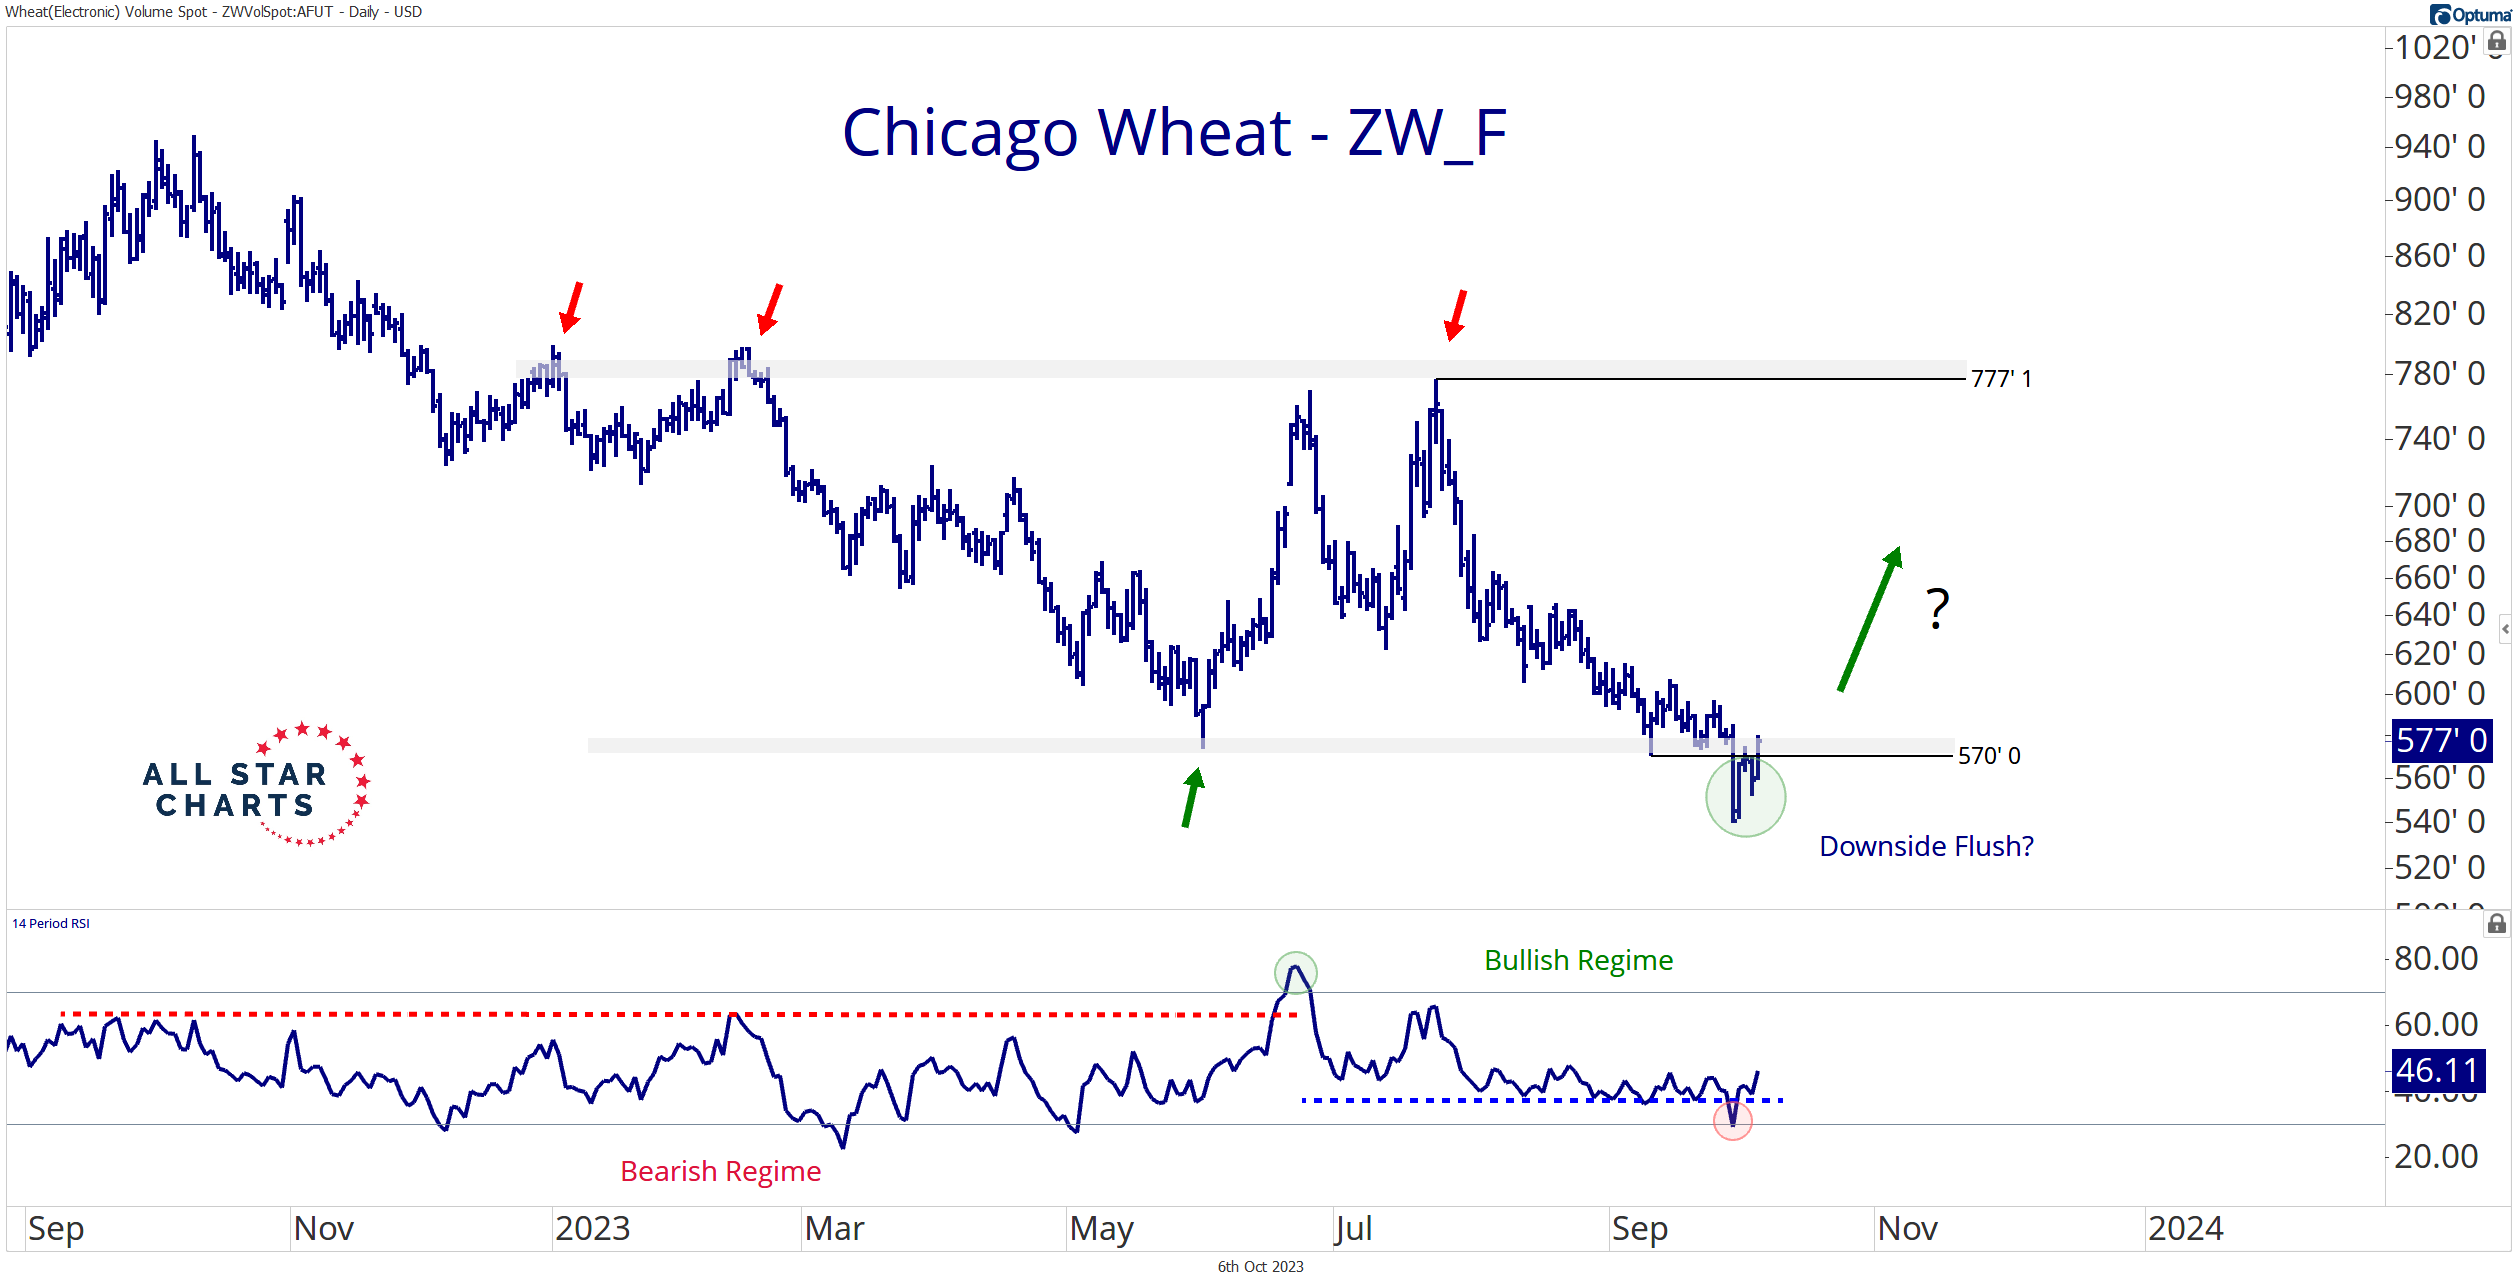
That’s my line in the sand.
Unfortunately, I was stopped out before today’s close as cocoa slipped back below 570’0.
I’ll consider another attempt at the long side in the coming weeks – market permitting.
Stay tuned.
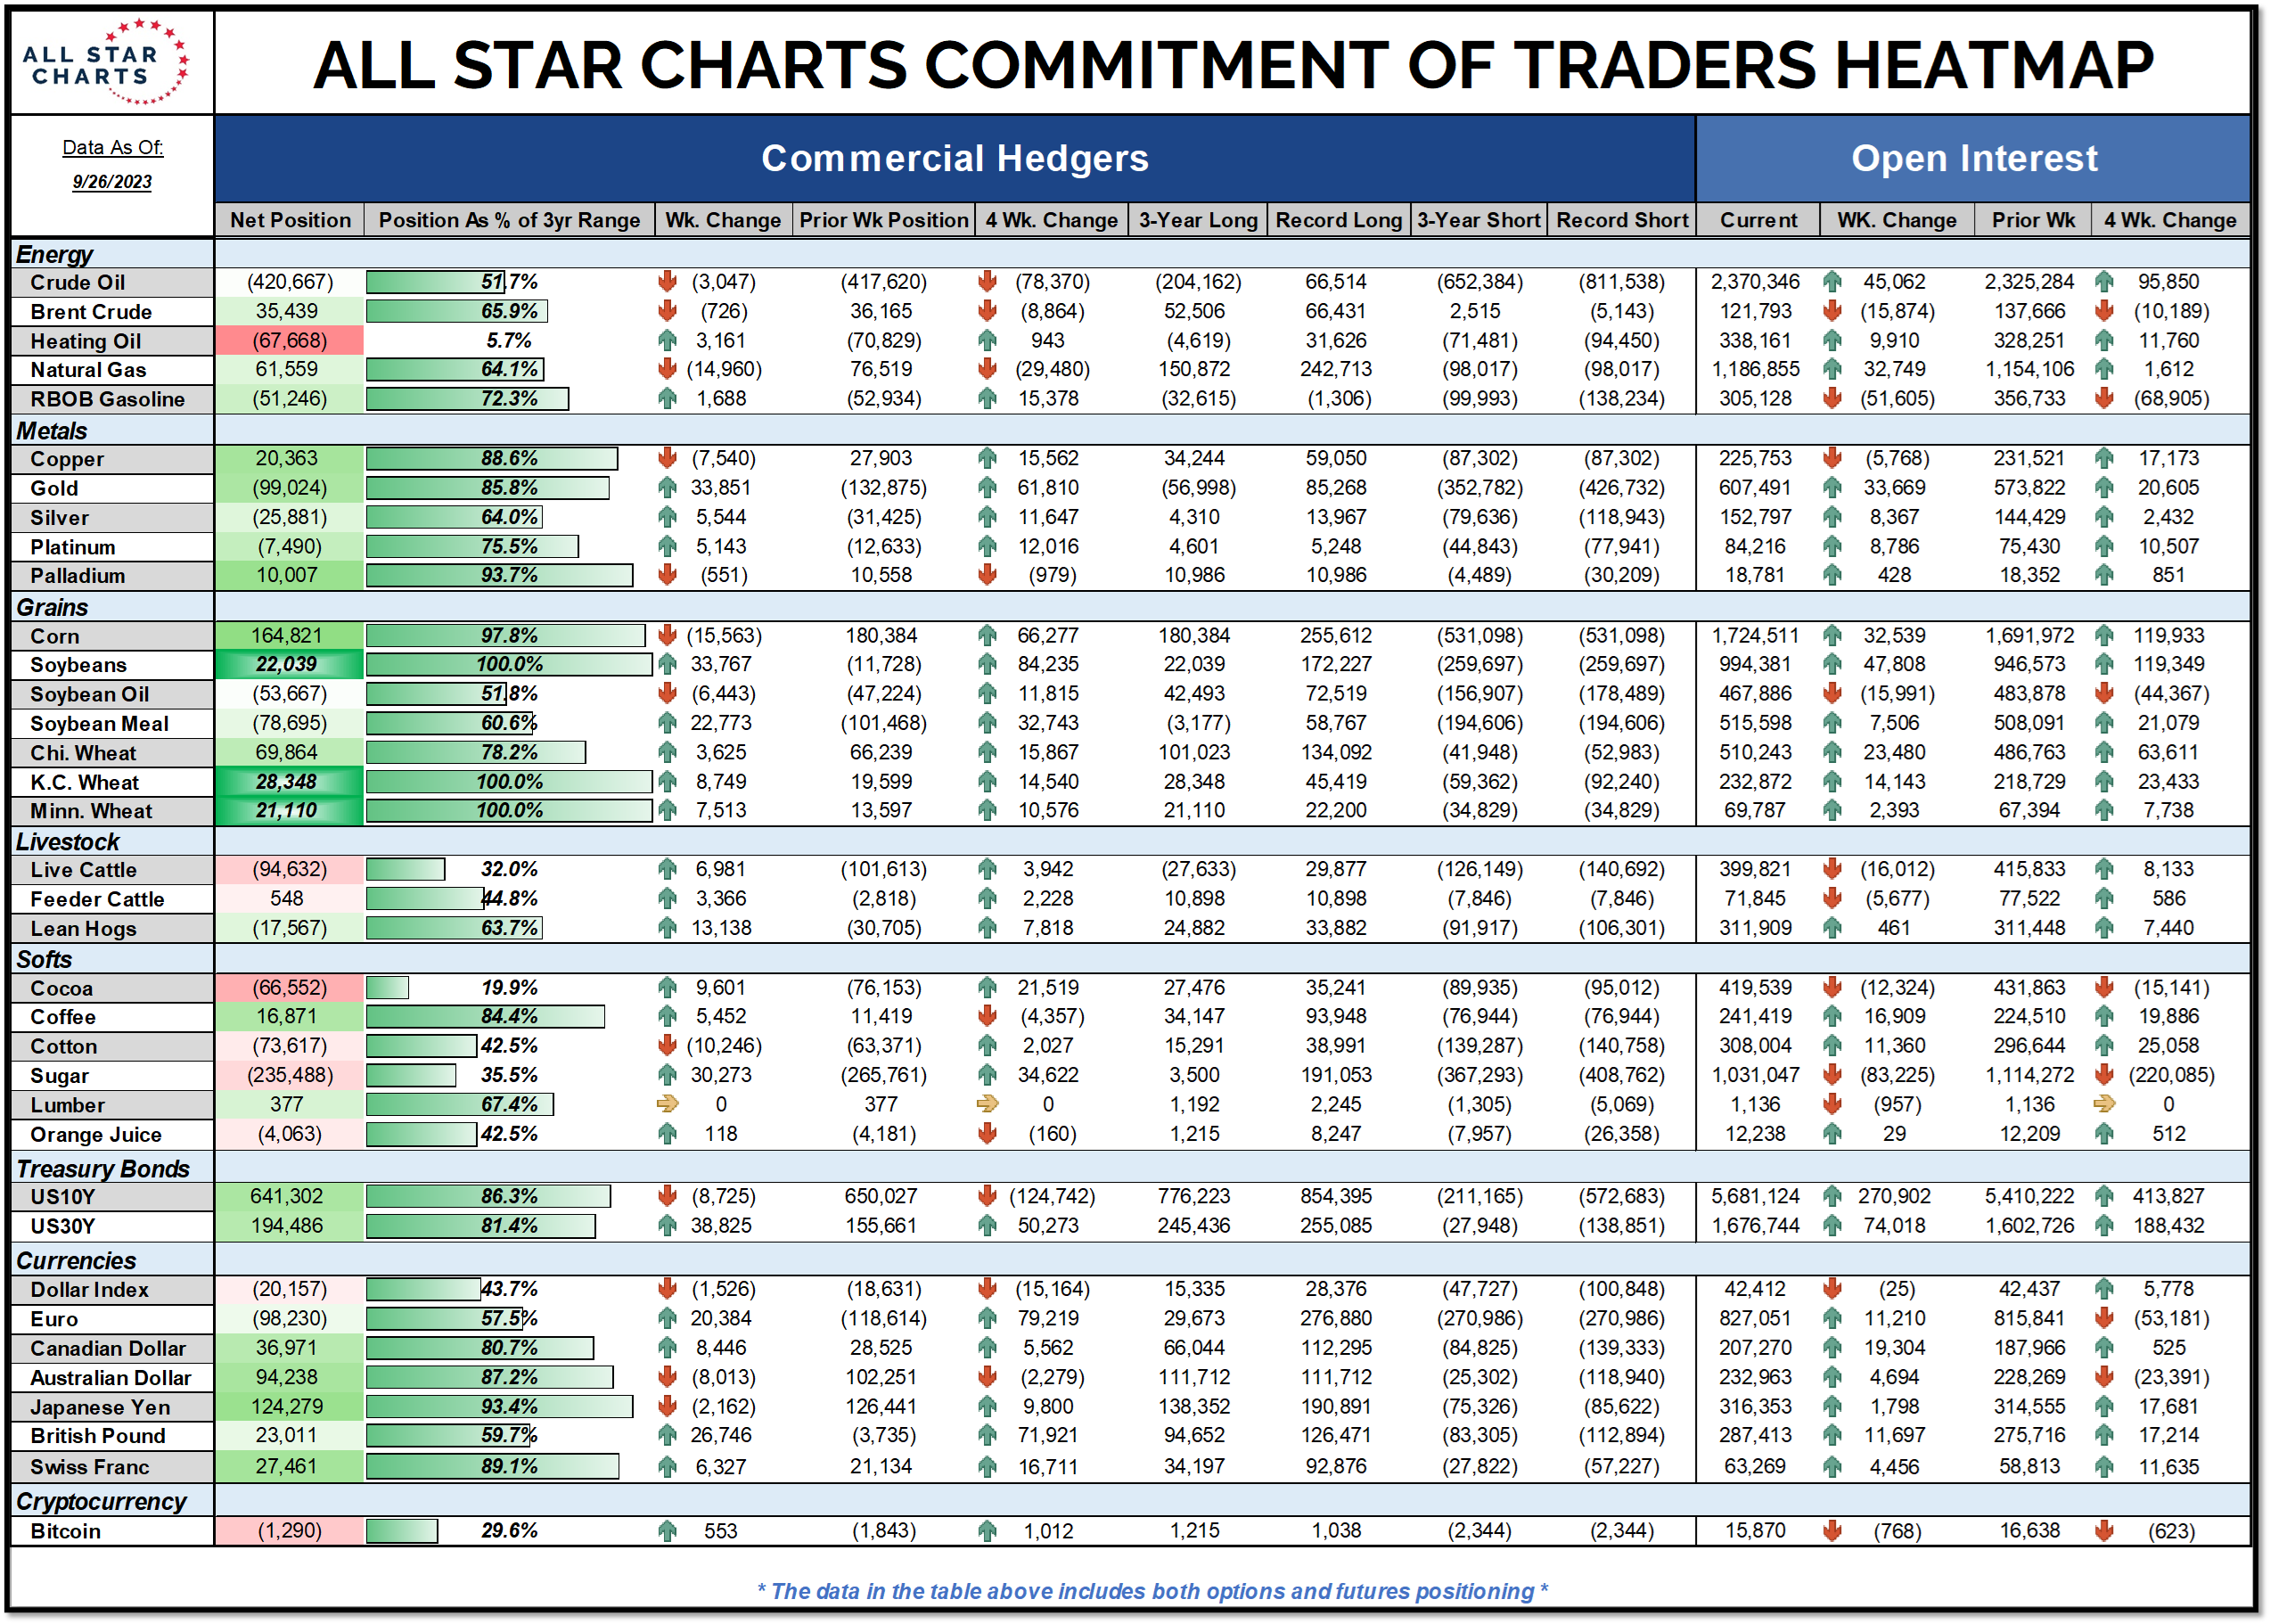
COT Heatmap Highlights
- Commercial hedgers continue to unwind their net-short cocoa position as price corrects lower.
- Commercials are within six percent of their most significant short exposure to heating oil in three years.
- And commercials hold three-year extreme net-long positions for soybeans, Minnesota wheat, and KC wheat.
Click here to download the All Star Charts COT Heatmap.
Premium Members can log in to access our Weekly Commodities Report Chartbook and the Trade of the Week. Please log in or start your risk-free 30-day trial today.
Be the first to comment