

New feature in Koyfin 🎁🎁🎁
Perform calculations on fundamentals in graphs. You can transform any fundamentals series into
y/y % change
q/q % change
indexed performance
….and others
Select the graph series, and in the settings, select a transformation
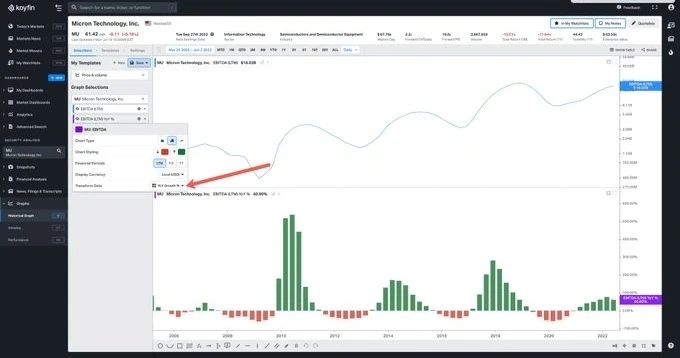
1. Example👇👇
2. Micron ($MU) is a cycle semi company. The y/y % change of EBITDA over several cycles shows that clearly.
Let’s also add the performance of the stock 12-months forward. At every point in history, this is how the stock performed over the next 12m
Link: https://app.koyfin.com/share/d49a18b1b5
3. Conclusion: The best time to buy $MU is the first quarter that LTM EBITDA y/y % change is negative because it’s gonna recover at some point.
4. Don’t forget to save the graph as a template to use it later without inputting the series every time
#koyfin #charts #investment #investing #stocks #ebitda #performance #markets
Be the first to comment