

From the Desk of Steve Strazza @Sstrazza
Monday night we held our September Monthly Conference Call, which Premium Members can access and rewatch here.
In this post, we’ll do our best to summarize it by highlighting five of the most important charts and/or themes we covered, along with commentary on each.
Let’s get right into it!
1. Overhead Supply Everywhere
Volatility has grasped the equity market as weakness expands beneath the surface.
The weakest areas of the market are leading to the downside, and the strongest sectors and industry groups are all stuck below overhead supply.
The chart below shows Technology Sector $XLK, Homebuilders $XHB Industrial Sector $XLI and Semiconductors $SMH being rejected at former highs.
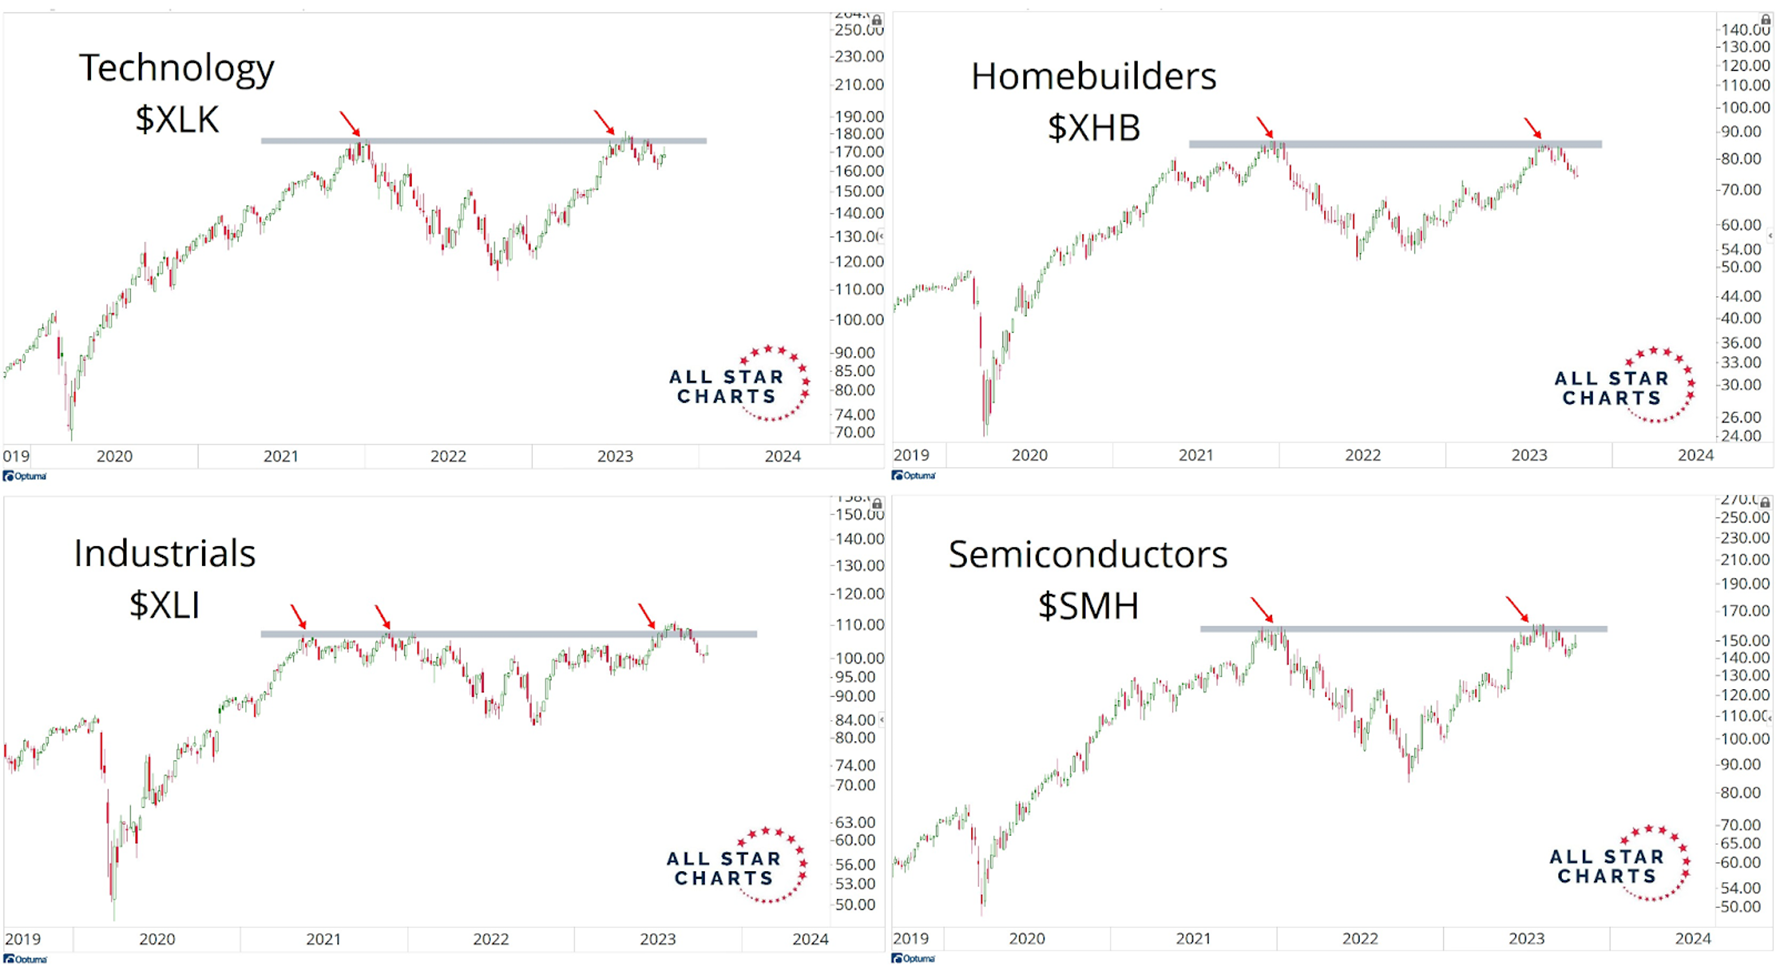
Sellers jumped in exactly where they did in 2021, defending these critical levels of interest.
As long as these sensitive groups are below all this overhead supply, stocks are likely to remain messy.
2. Last Lines of Support
When it comes to the market’s weakest areas, the Russell 2000 ETF $IWM and the Financial Sector ETF $XLF spring to mind as they threaten to breach critical support levels.
These levels represent when and where global risk peaked during the previous cycles.
As shown in the chart below, we’re keeping an eye on the 31-30 area for XLF, while the line in the sand for small caps lies at 170.
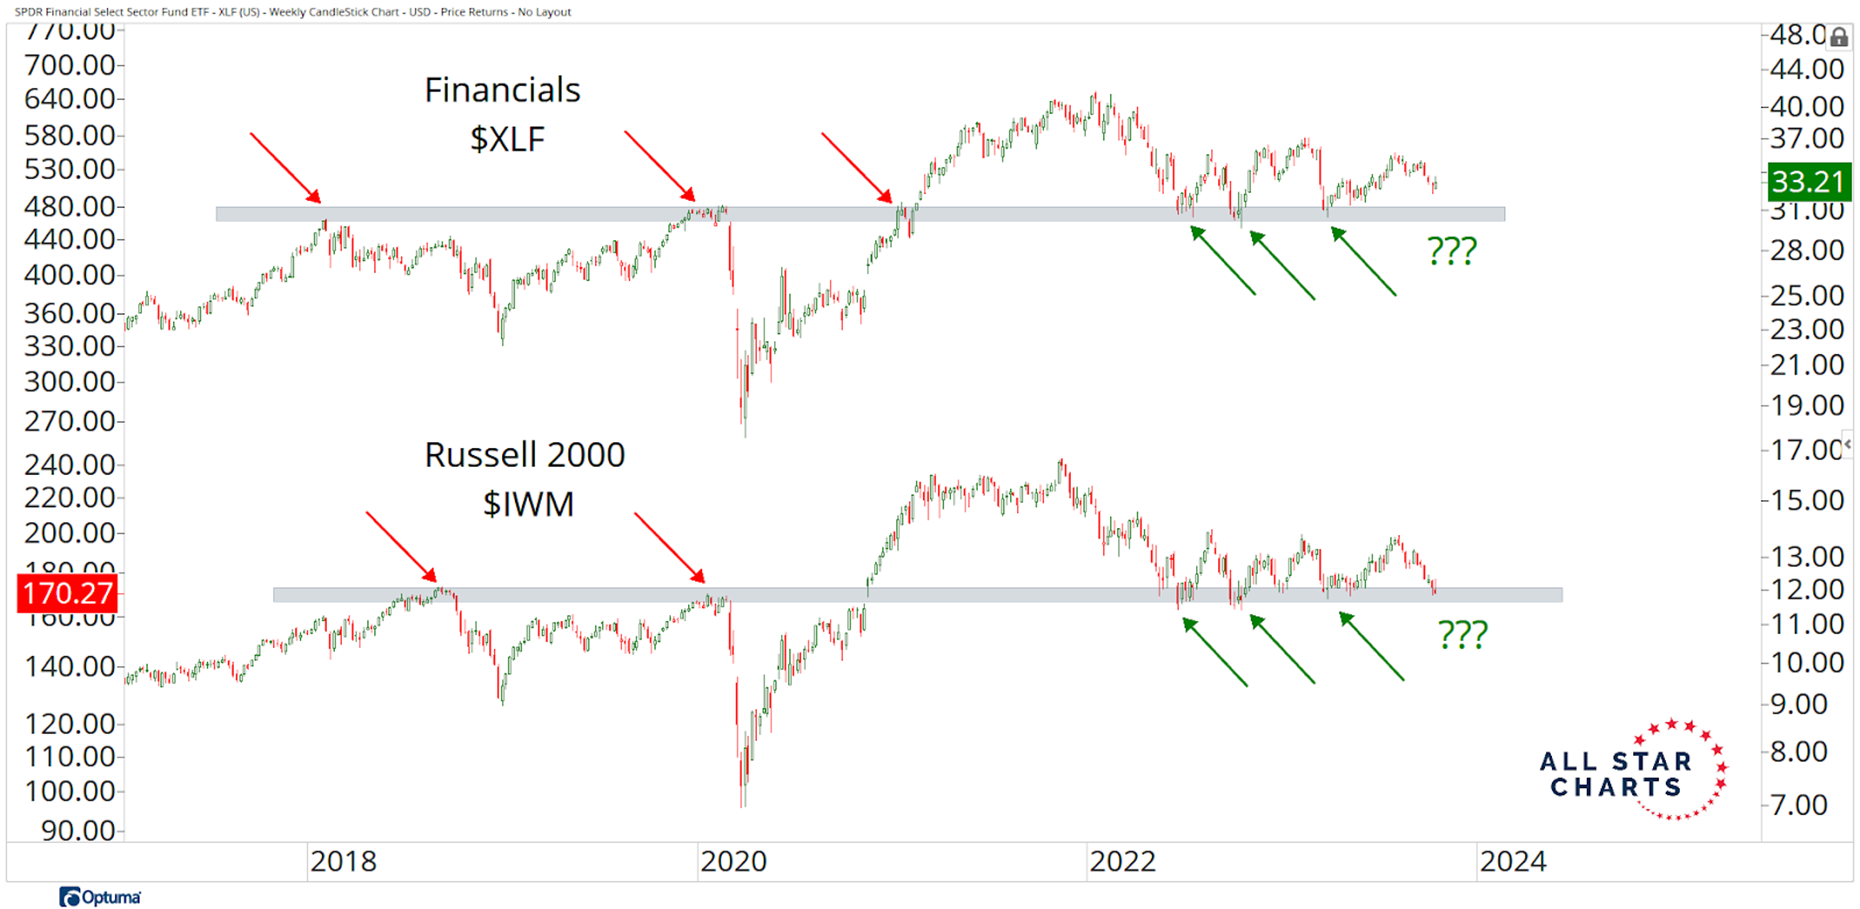
Bulls want to see these areas of interest hold. However, if they violate their former highs from 2018 and 2020, it will be a big problem for the overall market, and we’re likely to see increased volatility and a fresh leg lower for equities.
3. Big Reversal for Dollars
The US Dollar Index $DXY continues to be the catalyst for global risk assets.
As it turns out, DXY bottomed in mid-July and has been stair-stepping higher, nearly in a vertical line since.
Price recently reclaimed a critical level of former highs that coincide with the 38.2% retracement.
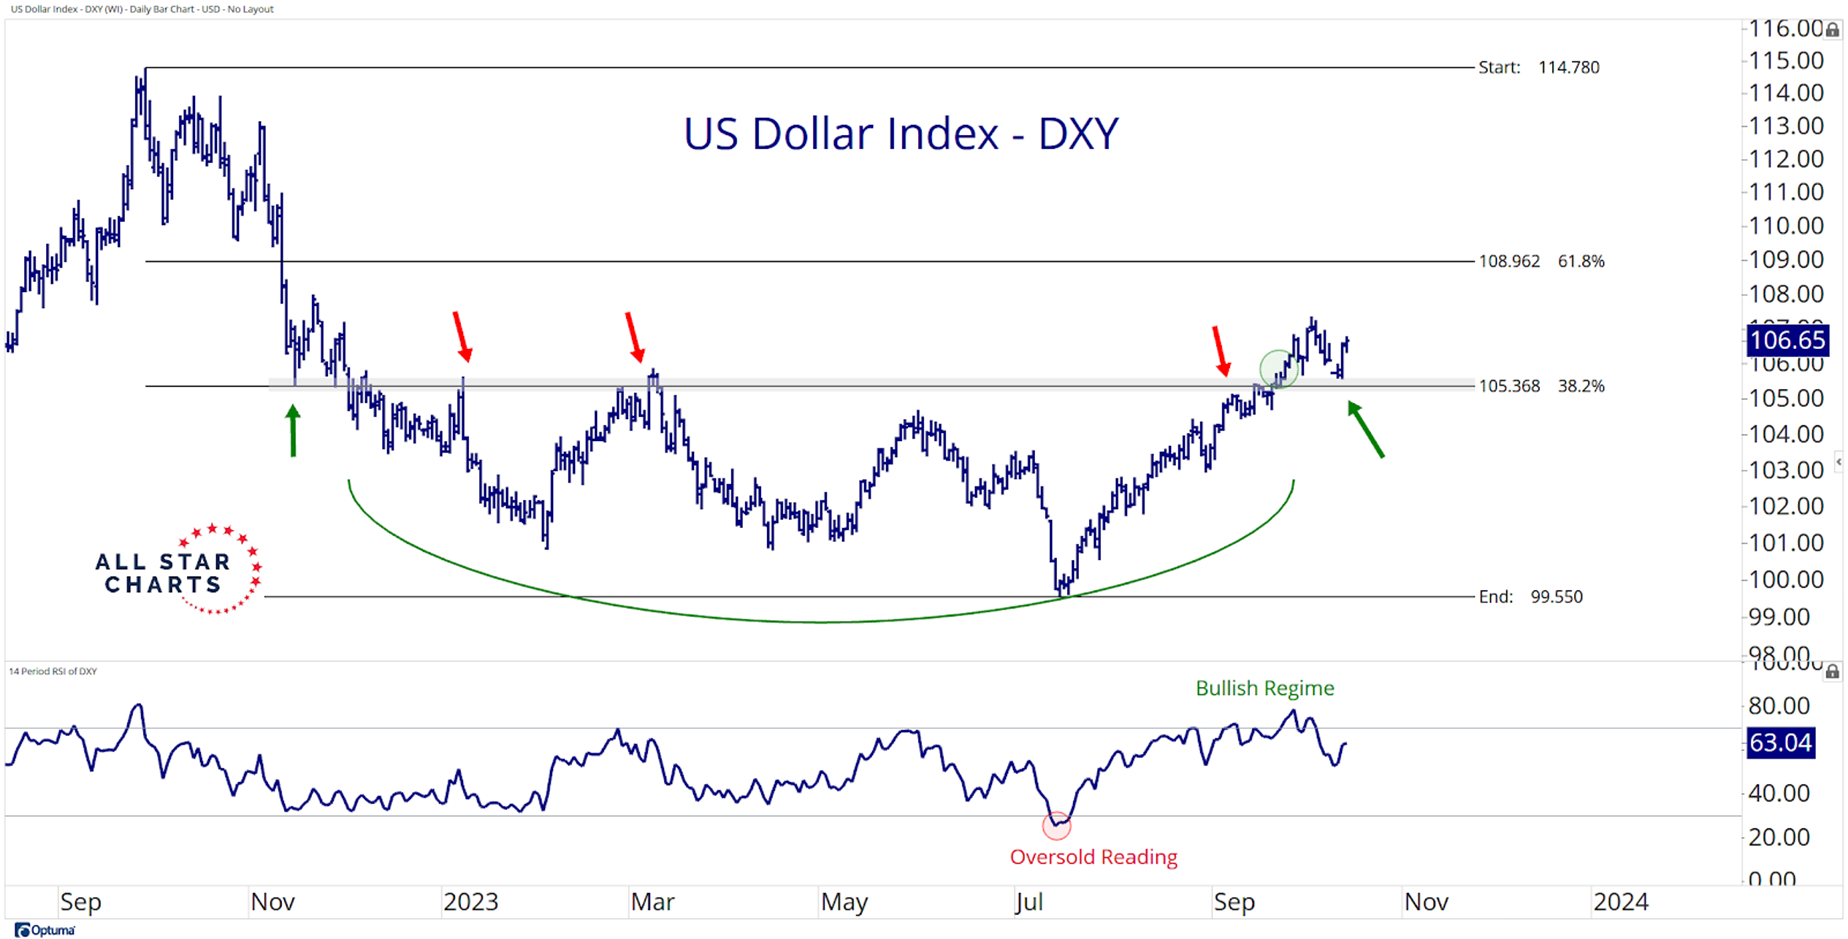
If DXY is above the 105.50 level, this reversal pattern is a valid one, and the path of least resistance is higher.
Under this scenario, we could continue to see headwinds in the equity market.
Bulls want to see DXY return to its old range as a sideways or falling dollar would relieve the pressure on risk assets.
4. Rates Keep Rocking
It is not only the dollar rising and putting pressure on risk assets. But rates across the globe are emerging to decade-long highs.
Fresh highs in yields add to the burgeoning concerns for long-duration assets, especially growth stocks. That has been the case for some time now.
The overlay chart of the US 10-year Yield and the Nasdaq 100 highlights the negative correlation between the two over the past year.
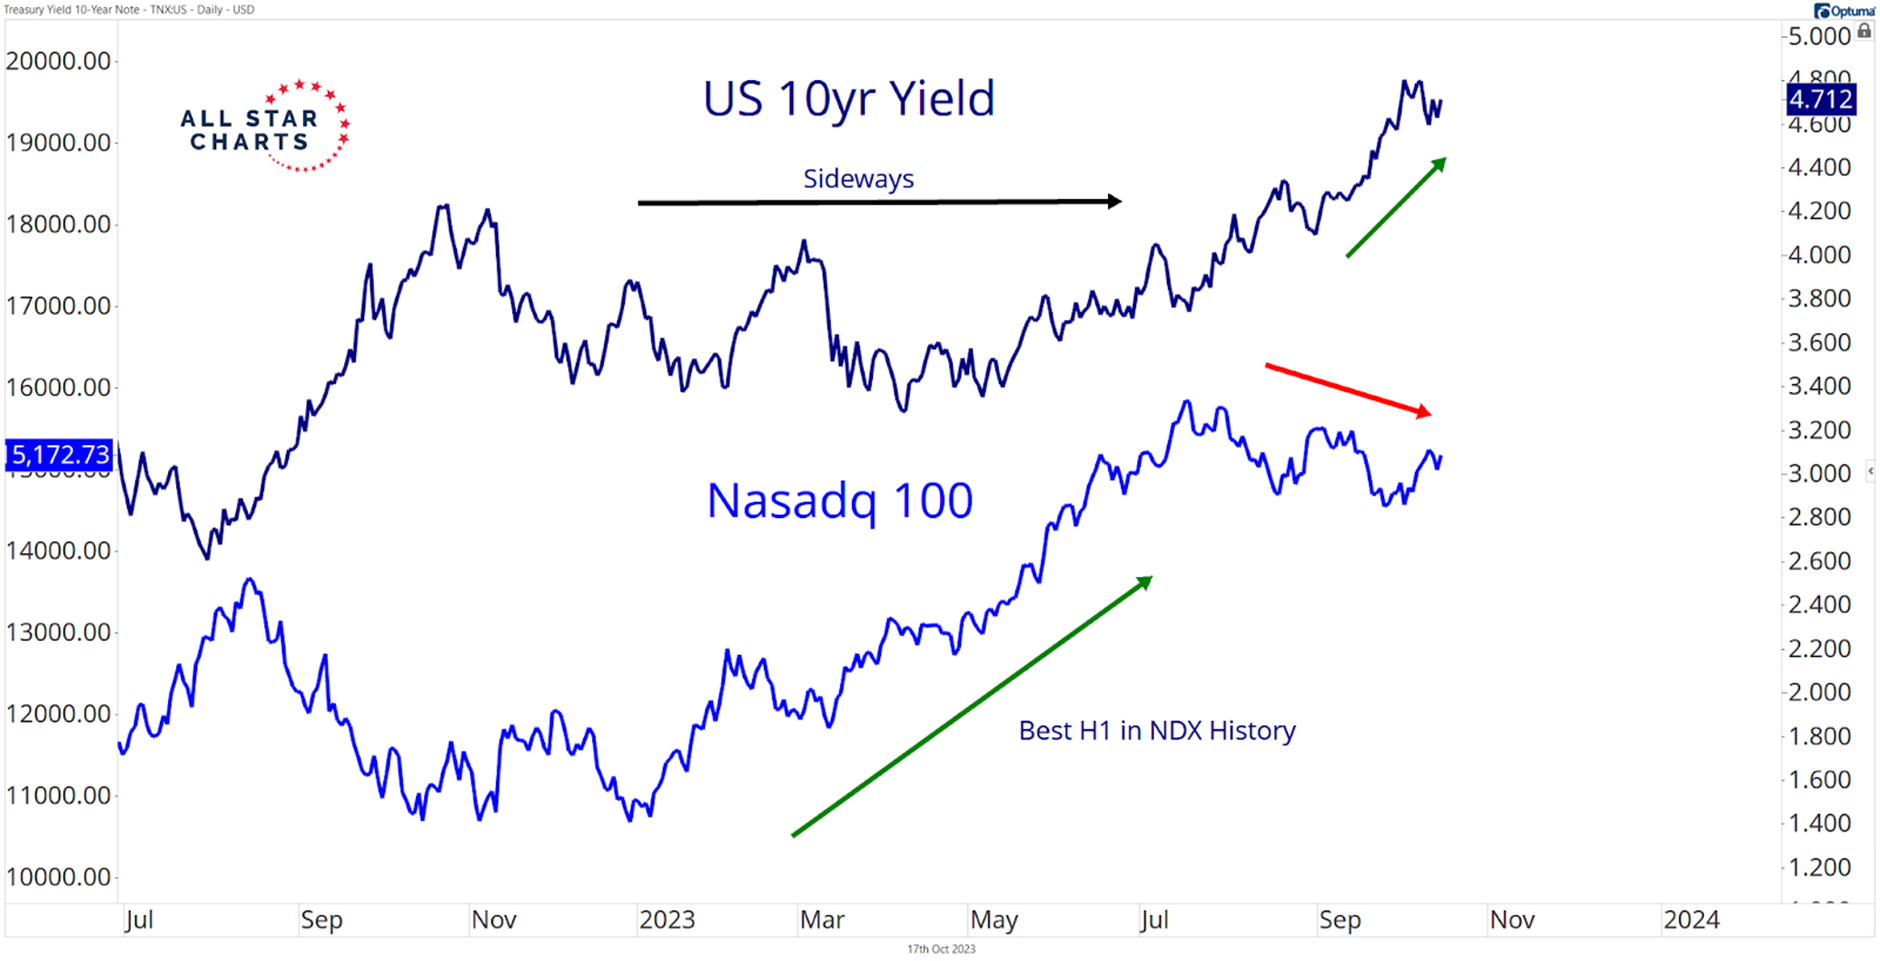
It’s no surprise that after a year of consolidation in rates, the QQQ had its best first six months ever. However, with the 10-year making a fresh leg higher, we’re seeing the opposite, with stocks falling since the summer.
As long as the bond market remains volatile, equities, particularly the growthy ones, are likely to be under pressure.
5. Large Beats Small
Although the conditions suggest remaining cautious, the relationship between large and small caps might help us position ourselves and determine where to focus.
The chart below shows the Russell 1000 ETF $IWB relative to the Russell 2000 ETF $IWM breaking out of a massive base:
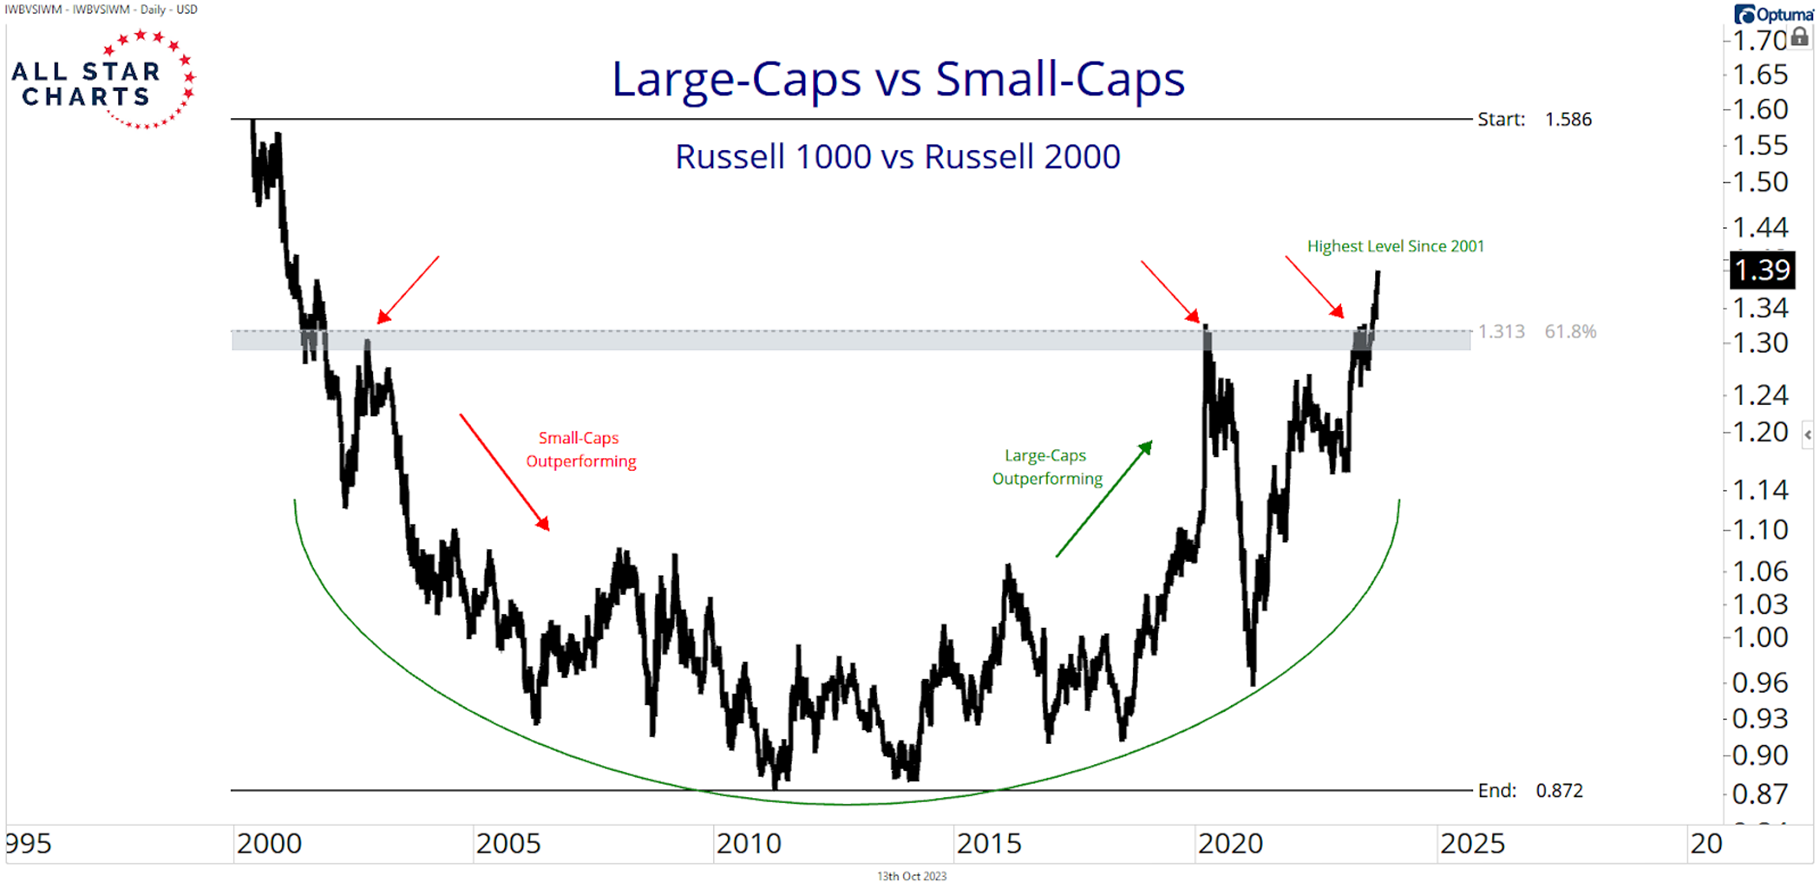
As long as this breakout holds, we expect large-cap equities to continue outperforming their small-cap counterparts for the foreseeable future.
Under this scenario, we want to hunt for relative strength in some of the largest stocks in the market.
As always, Premium Members can rewatch the Conference Call and view the slides here!
We hope you enjoyed our recap of this month’s call. Thanks for reading, and please reach out to us with any questions!
Be the first to comment