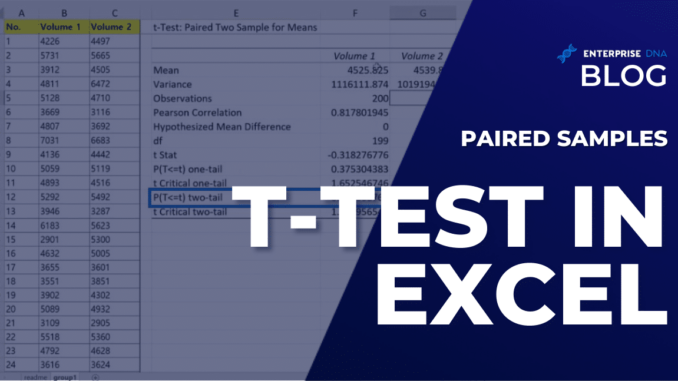
In this tutorial, you’ll learn how to execute and interpret the paired samples t-test using Excel. You can watch the full video of this tutorial at the bottom of this blog.
The paired sample t-test is going to check for a difference in the means of observations. So, we’re dealing with quantitative data between one time period and another. Also, we are dealing with a time series data.
This is going to be a hypothesis test with all of the fittings that go along with that. If you want to learn more about how to do a hypothesis test in Excel, you can check out my book Advancing Into Analytics.
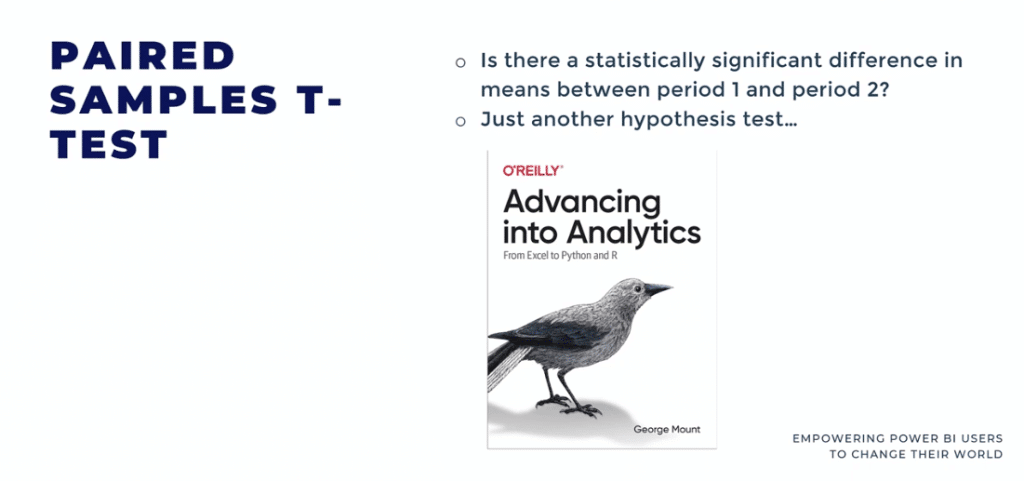
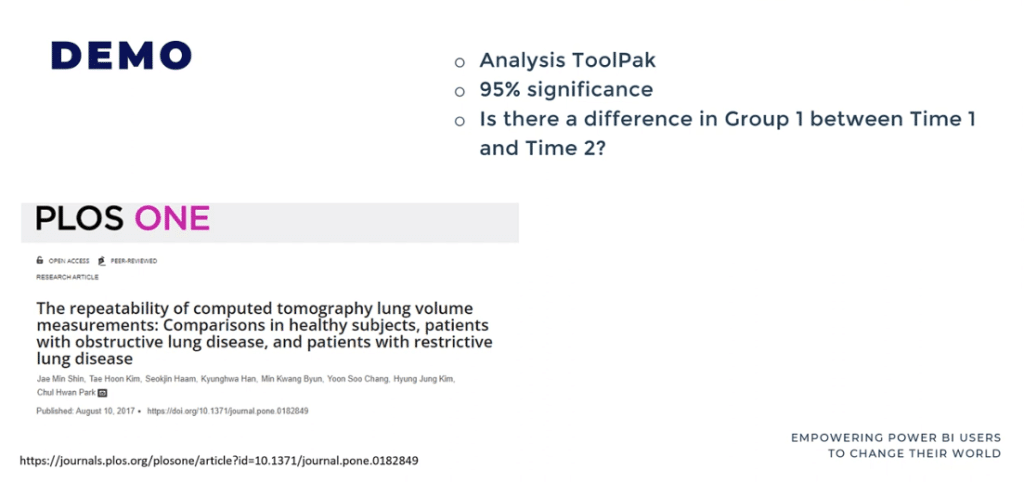
We won’t go too much into the theory, but we will be using the Analysis Tool Pack in Excel, where we will be testing at the 95% significance level and using a peer-reviewed data set from Plos One.
Basically, what we want to find is whether there’s a difference in the means for Group 1 between Time 1 and Time 2. We are going to try to reproduce a research study.
Executing & Interpreting Paired Samples T-test
Let’s go ahead and dive into Excel. We can run this per sample test and then we’ll regroup and go from there.
In this data, these are individual patients. They were measured in a period called Volume 1 and then given another measurement in Volume 2.
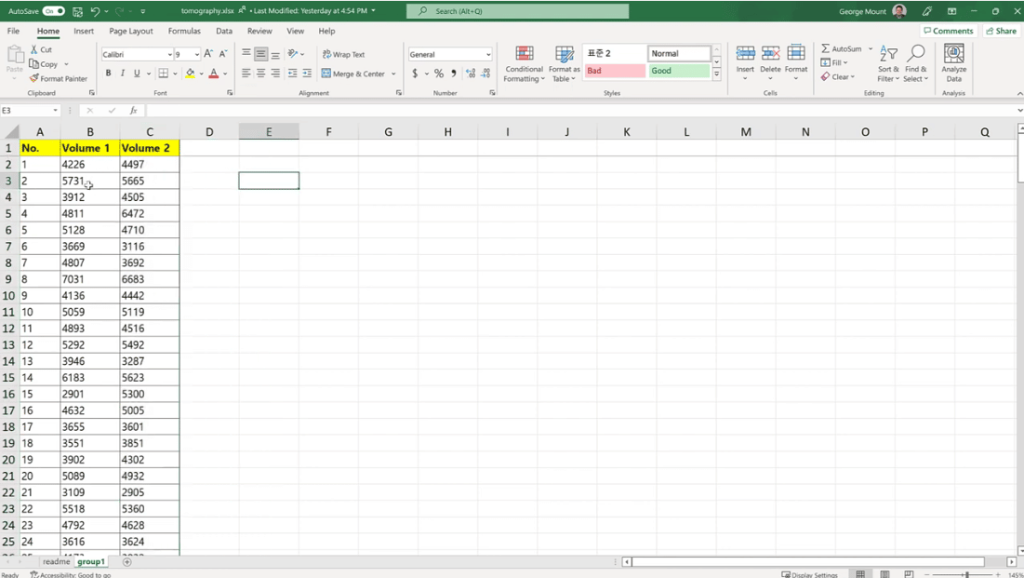
We need to know the measurements at both periods else we cannot use these patients or these observations. That’s one thing to know about the paired samples t-test.
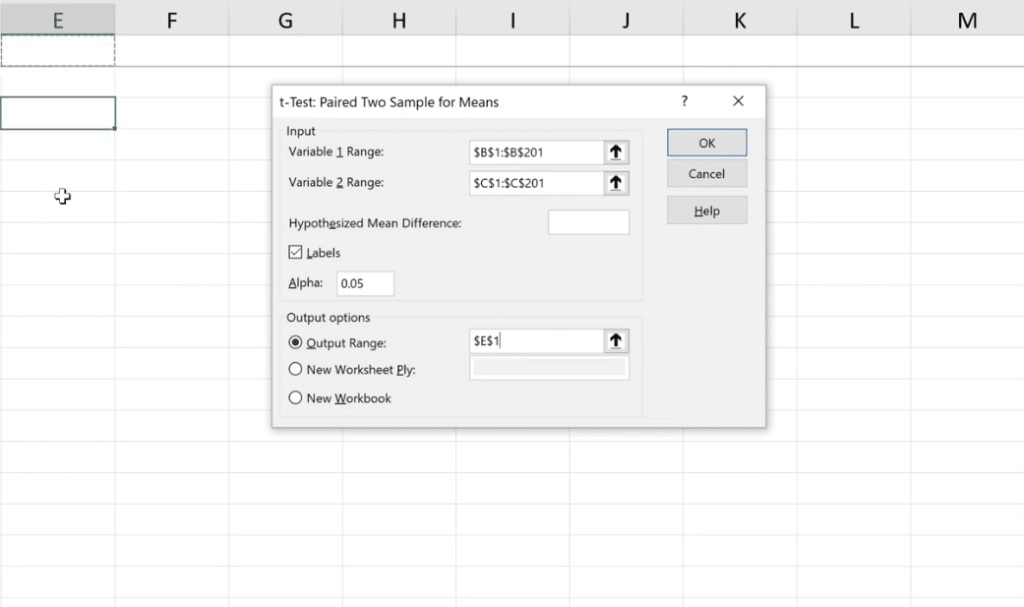
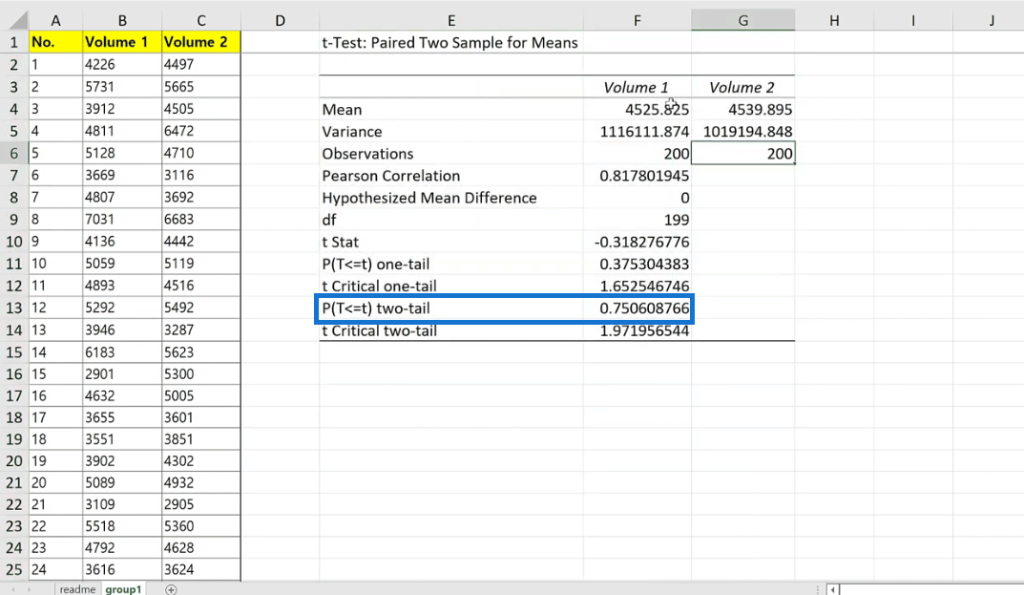
Let us take the average of Volume 1 & Volume 2 data and then get the difference between the two. It looks like Volume 2 is a bit higher by 14.07.
The nice thing about using hypothesis testing is that we can really dig into this and decide whether what we are seeing is just a fluke or not.
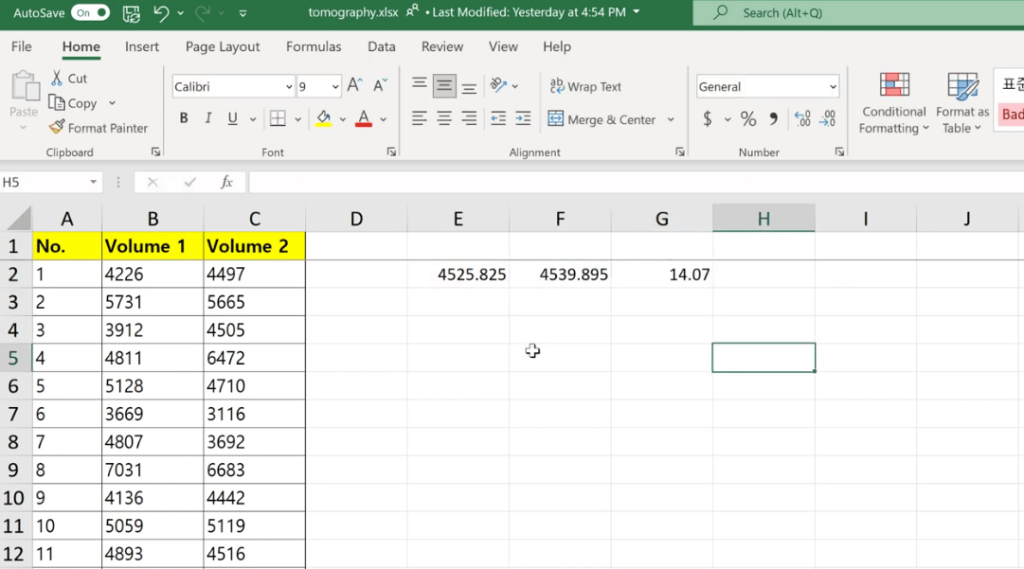
The next thing to do is go to the Data section and then select Data Analysis Tools. If you’re not familiar with the tool pack, you can check out the book to learn how to install it or do a web search.
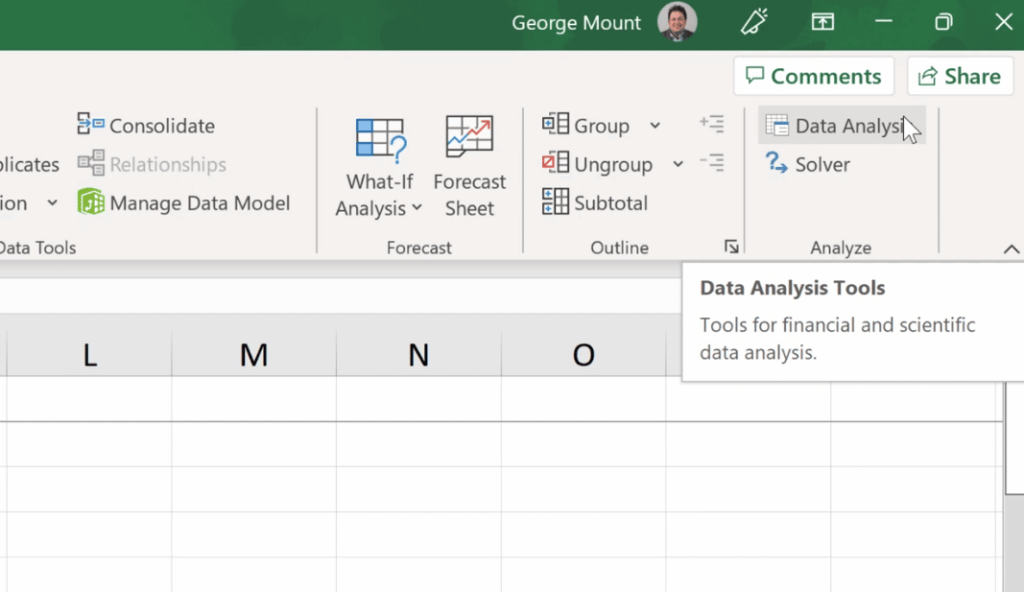
From the options, select t-Test: Paired Two Sample for Means then click the OK button.
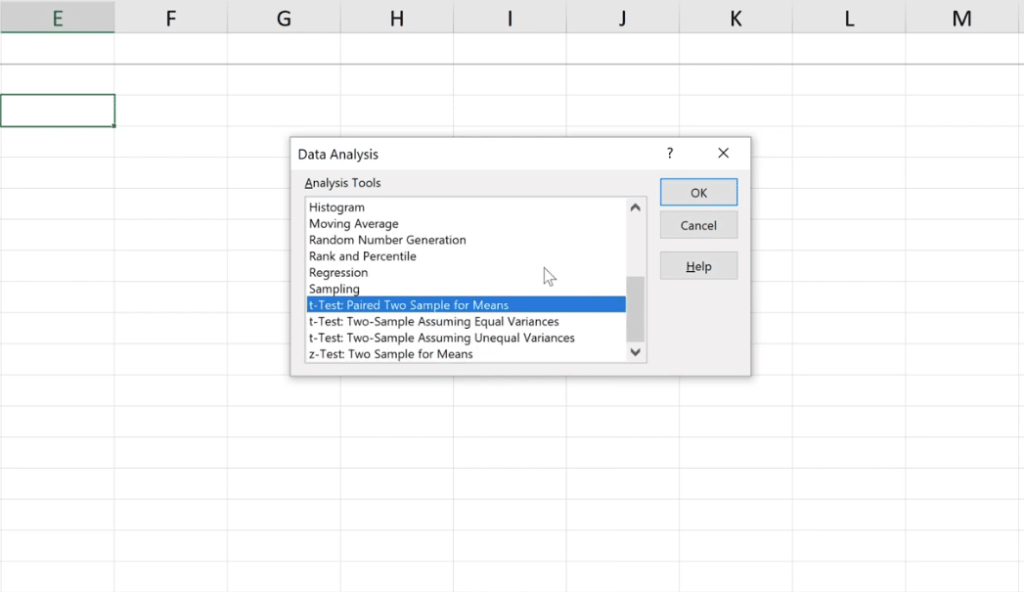
For this window, we need to enter two ranges.
For Variable 1 Range, select the entire range of Volume 1 data by pressing CTRL + Shift + arrow down. Let’s also select the entire range of Volume 2 for the Variable 2 Range field.
We got the same number of observations in each group, which makes sense because we need those observations for each patient.
Since we have labels in the first row, let’s check the Labels checkbox then for Hypothesized Mean Difference, leave it blank. It’s going to assume that the mean difference is significantly different than zero. We can also check if it’s different than 5 or -10, but 0 is the most common.
For the Output Range, we can put this in the same worksheet then click OK.
Noticeably, this is a very menu-driven approach in finding the difference on this test. We can see the same numbers that we did earlier.
Next, I want you to focus your attention on the P(T<=t) two-tail value, which is 0.751. It means that it’s probably not a significant difference even though this number is a little bit higher statistically speaking. We cannot say that it’s likely different than 0.
Again, the objective is to take your analysis to the next level by applying hypothesis testing to it.
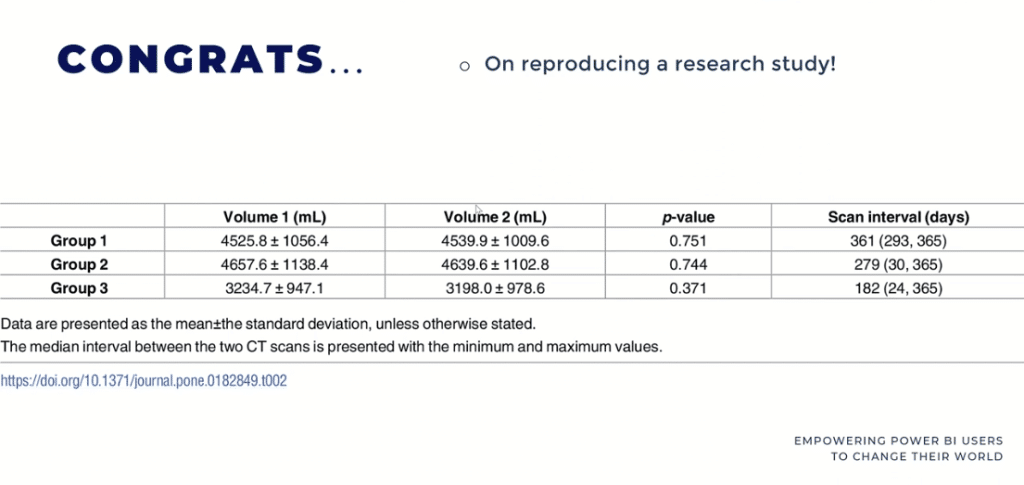
Finally, let’s check out the data for Group 1.
Based on the table, we can see from the Plos One Journal that the p-value is 0.751. This means that we were able to reproduce the research results of this report, which is awesome!
Kudos to the researchers as well for having their data published and made available to the public so that anybody can access this.
Most often, the paired samples t-test is used when there’s an intervention, whether that’s in medicine, marketing, or education. Hence, this is often a social science test to use and know whether there’s been some change given in intervention.
However, the difficult side of it is that we need to have the observations for both pre- and post-intervention, which is hard to do often in business settings.
***** Related Links *****
Chi-Square Test In Excel: Comparing Variables
Excel Hacks Every Business Should Know
ggplot2 Plots In Excel For Advanced Data Visualizations
Conclusion
A paired samples t-test is a statistical procedure used to compare the means of two related groups or samples. It is commonly used in situations where you have two related samples that you want to compare.
This makes it an accessible and convenient tool for researchers and analysts who need to quickly and accurately compare the means of two related groups.
Overall, this is an essential tool for anyone working with data and seeking to draw meaningful conclusions from it.
All the best,
George Mount
[youtube https://www.https://www.youtube.com/watch?v=EF9XCb5arp0&w=784&h=441]

Be the first to comment