

Welcome back to this week’s edition of the Power BI
blog series. This week, we will begin exploring the Preview of datamarts
in Power BI.
Datamarts are self-service analytics solutions, enabling users to store and
explore data that is loaded in a fully managed database. Since datamarts are usually a subset of the
full database, teams may be given
access to the information they require only, enabling them to share relevant
data and insights within those teams.
Last week, we
looked at the differences between datamarts and data warehouses. This week, let’s consider how Power BI
supports datamarts.
Power BI
allows us to pull data into the datamart from a variety of sources:
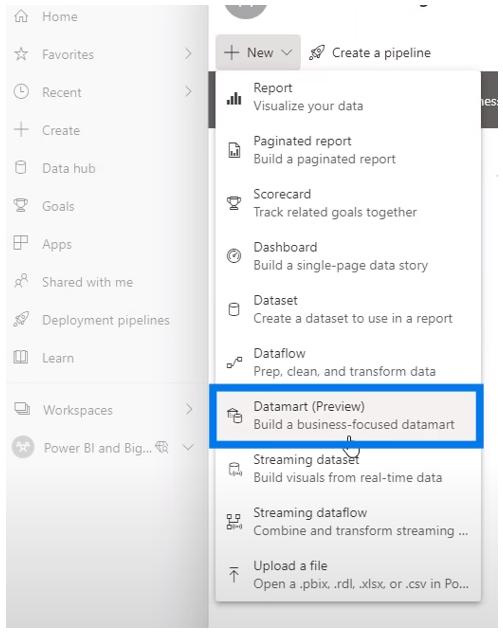
In order to
access datamarts, we need a Premium or Premium per-user
account. Assuming you have this, on the workspace page, click on the
New button and then click on ‘Datamart (Preview)’ in the dropdown menu:
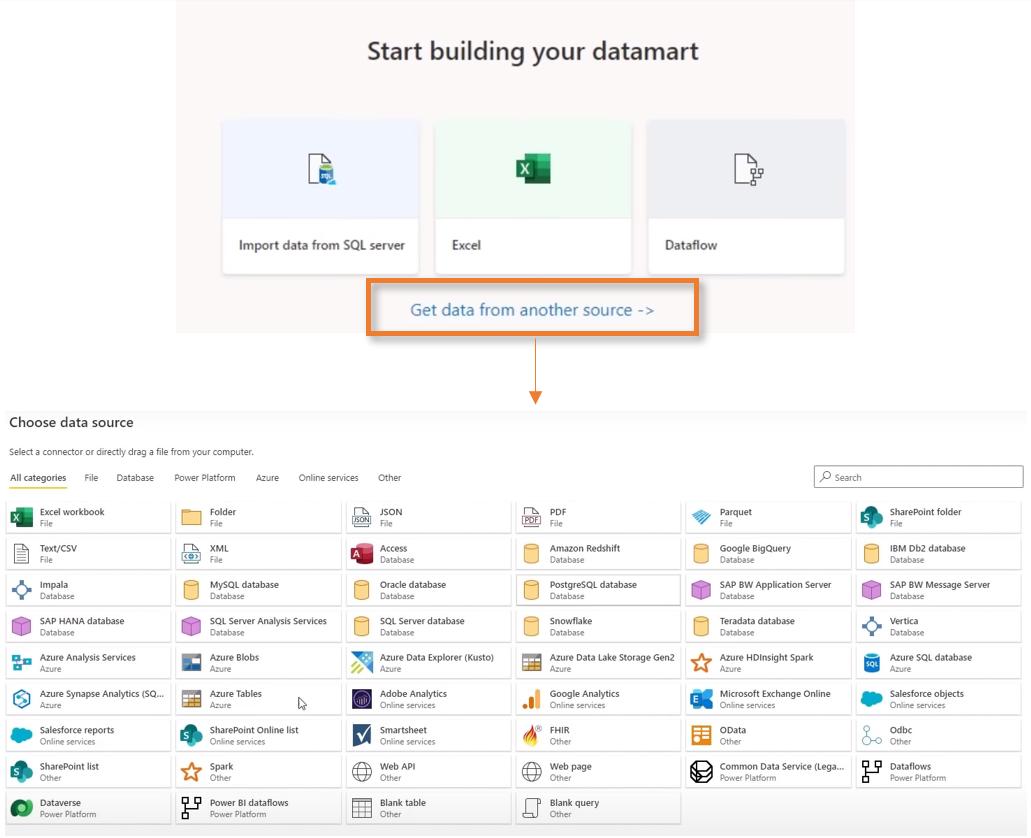
With the datamart created, we can now select
the data source. The default options are
from Excel, importing data from an SQL server or a dataflow. However, we may click on ‘Get data from
another source’ to see all of the supported sources.
For this
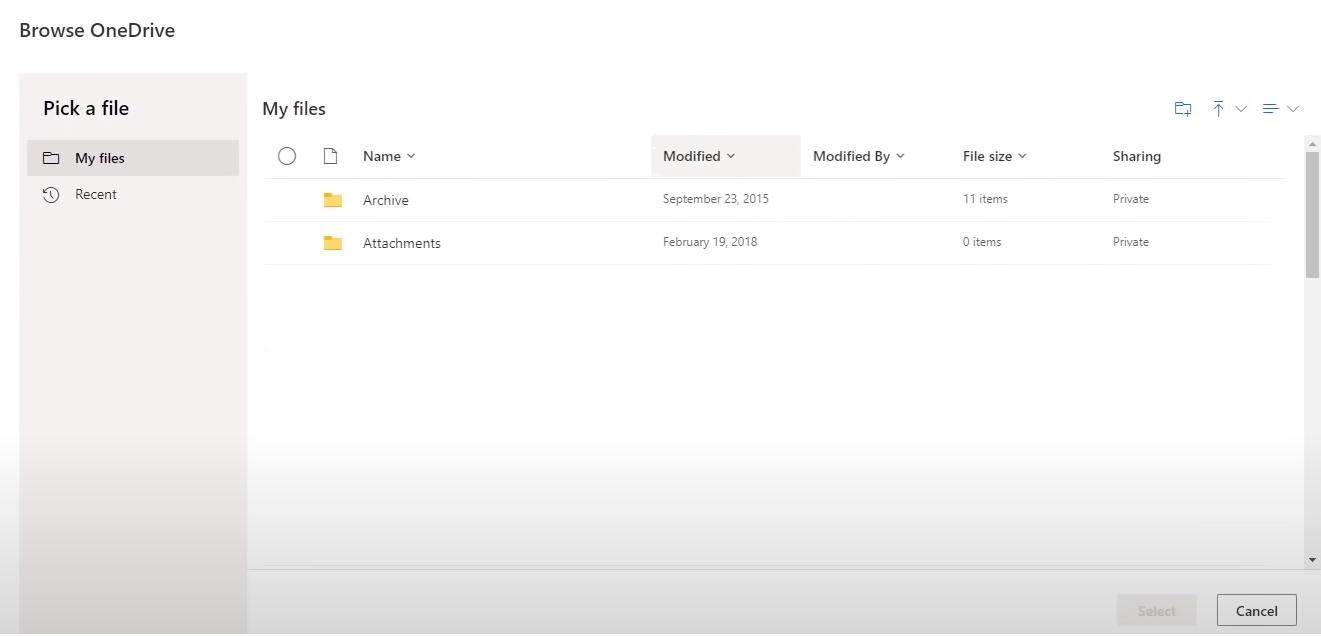
example, let’s use an Excel workbook stored on OneDrive.
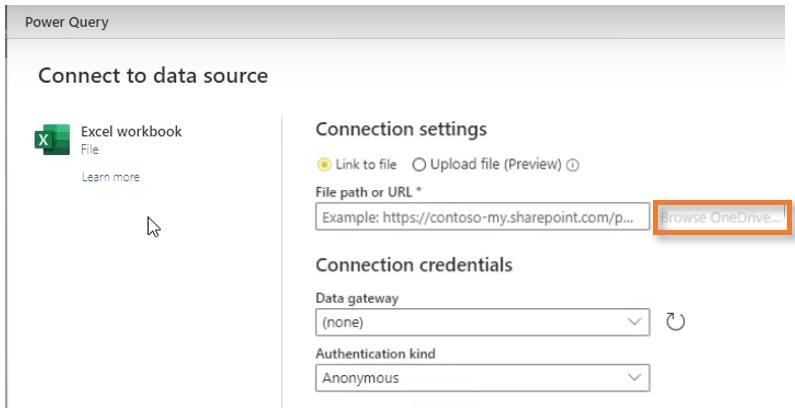
We can
browse OneDrive for our file, click on it, and then click on the Select button in
the bottom right-hand corner.
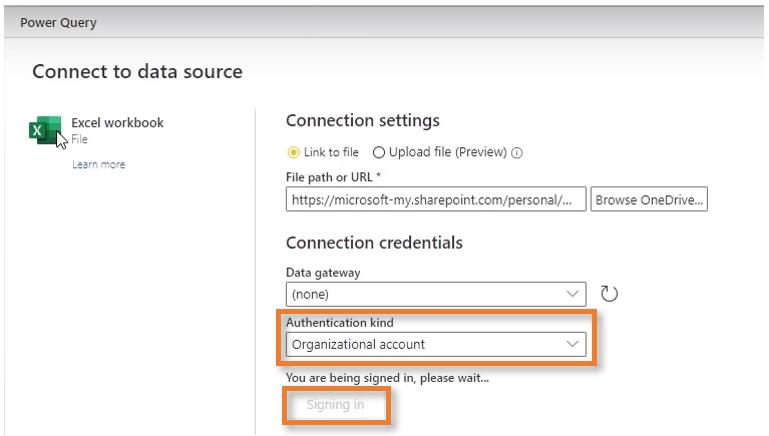
With the
file selected, we can now select the ‘Authentication kind’. In this instance, we will select ‘Organizational
account’ (sic) and then click on the ‘Sign in’ button, which changes to
‘Signing in’ to indicate the action is being processed:
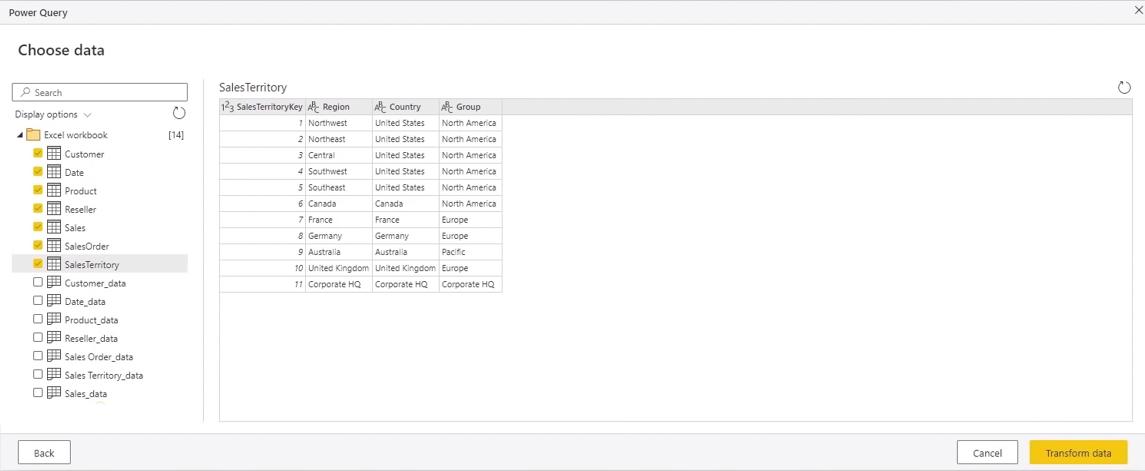
After signing
in, we are presented with the ‘Choose
data’ window.
Once data has been selected, the following Power
BI screen appears:
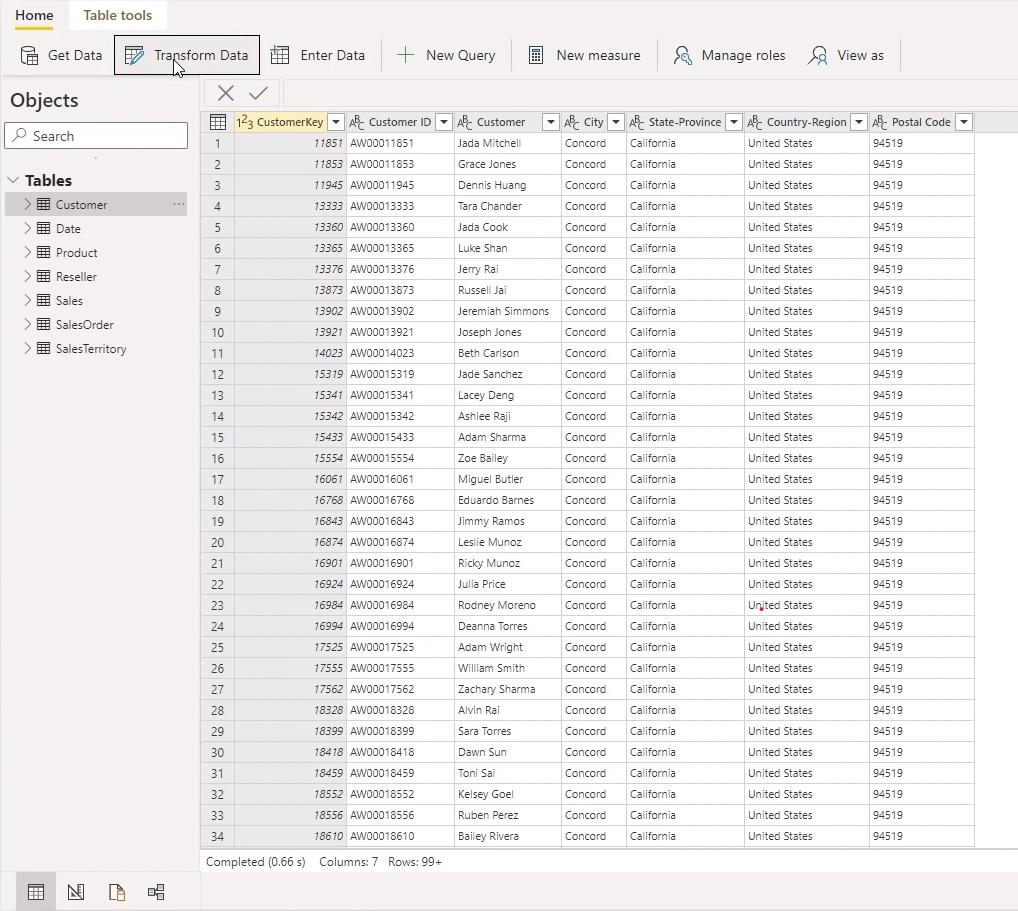
From this screen, we may access the Power
Query editor through the ‘Transform Data’ and ‘New Query’ buttons, allowing us
to enter and modify queries that manipulate the data. The ‘Model view’ icon on the bottom left-hand
side, allows us to create and manage the relationships between tables.
If required, it is possible to create
measures in DAX, by clicking on the ‘New measure’ button on the Home
tab. However, the online editor does not
currently support the creation of DAX calculated columns and tables.
Clicking on the ‘Manage roles’ button
allows us to add row level security (RLS). After assigning a security role, we may
utilize the ‘View as’ button to see how the data would appear from the perspective
of a member of that role.
Next time,
we will look at generating queries for the data in a datamart.
Check back next week for more Power BI tips
and tricks!
Be the first to comment