

Welcome back to this week’s edition of the Power BI
blog series. This week, we will look at generating queries using the user
interface (UI) available for datamarts.
Datamarts are
self-service analytics solutions, enabling users to store and explore data that
is loaded in a fully managed database.
Since datamarts are usually a subset of the full database, teams may be given access to the information they
require only, enabling them to share relevant data and insights within those
teams.
Last week, we began
looking at how Power BI supports datamarts.
This week, let’s take a look at how we may create queries within a
datamart.

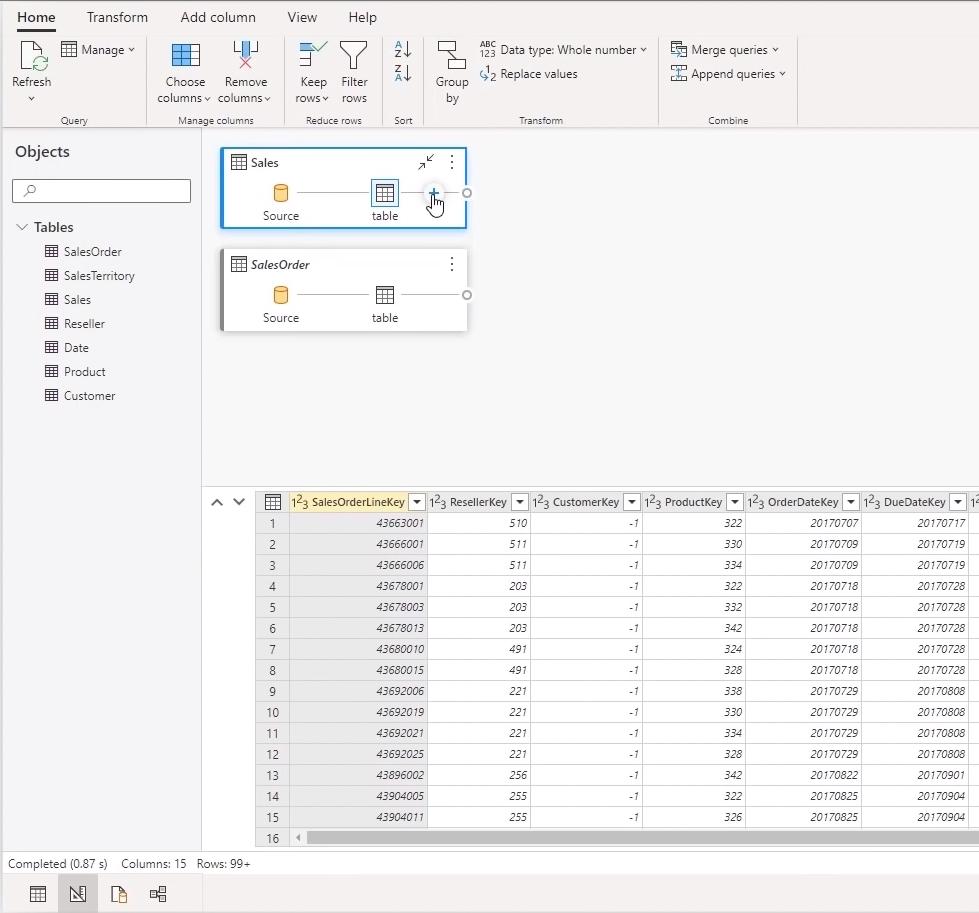
The design icon on the bottom left-hand
side allows us to select, drag and filter tables, remove columns and merge or
append queries. In this example, we want
to find the top sales order, thus the Sales and SalesOrder tables
have been selected and dragged to the stage screen. Then, we can press the plus icon (+)
as shown below:
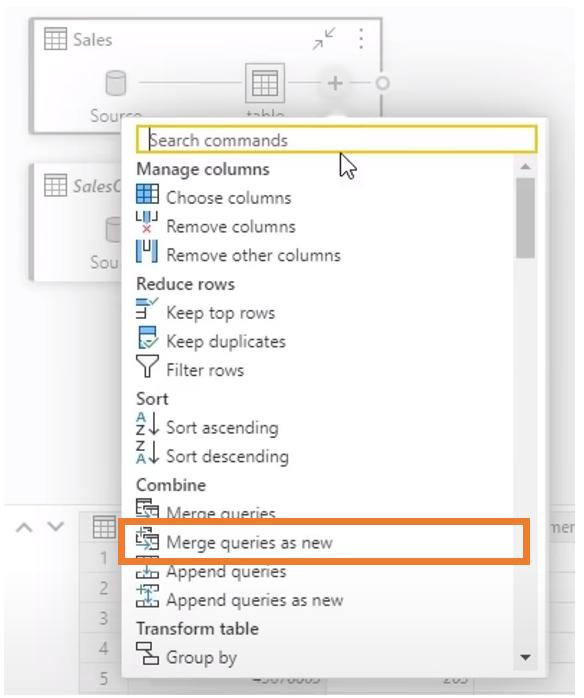
We may then select to ‘Merge queries as
new’.
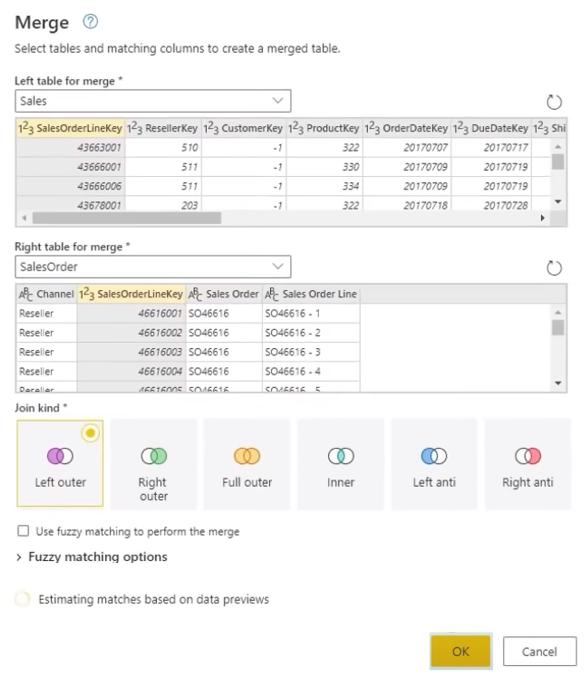
Like transforming
data in Power BI desktop, merging queries allows us to select the tables to
merge (i.e. incorporate additional columns / fields). We must specify the matching columns and the ‘Join
kind’, by choosing the appropriate icon.
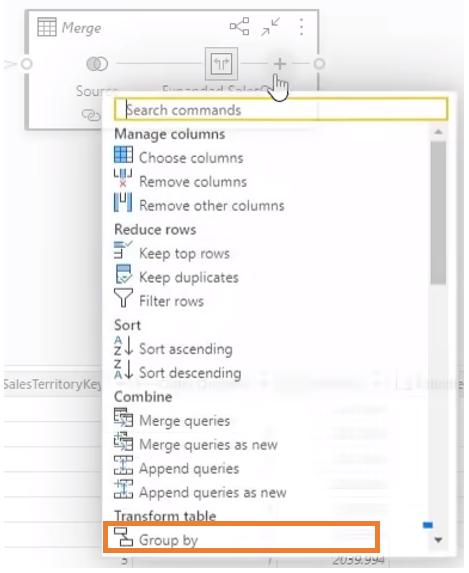
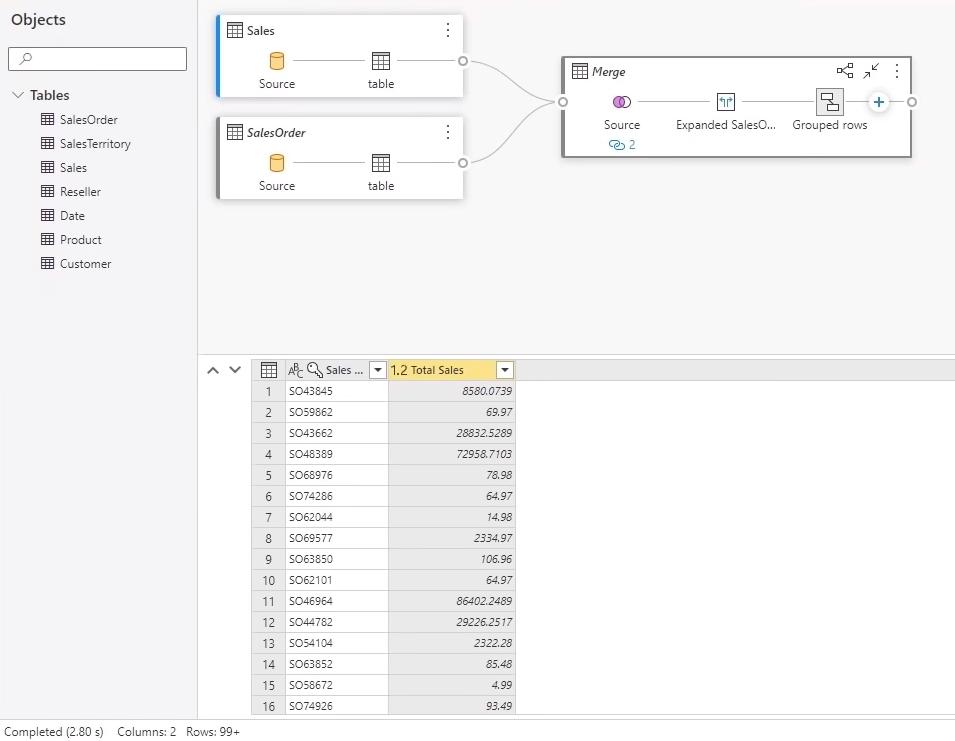
With our tables
merged, we can click the plus icon in the merged table, and select ‘Group by’:
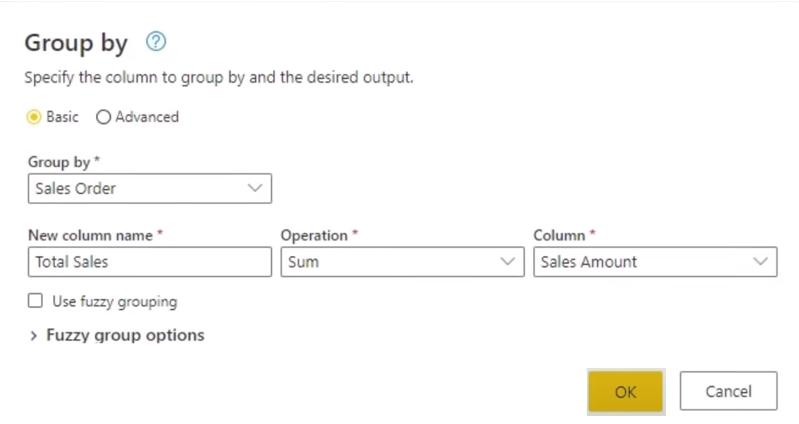
In the dialog
that pops-up, we select Sales Order in the ‘Group by’ section and call the
new column Total Sales. We select
Sum as the Operation and Sales Amount as the Column to be summed:
After pressing
OK, we have a table of each Sales Order and the total corresponding Sales
Amount:
Next time,
we will look at the refresh options for datamarts.
Check back next week for more Power BI tips
and tricks!
Be the first to comment