

Welcome back to this week’s edition of the Power BI
blog series. This week, we will look at creating reports using the data in
a datamart.
Datamarts are
self-service analytics solutions, enabling users to store and explore data that
is loaded in a fully managed database.
Since datamarts are usually a subset of the full database, teams may be given access to the information they
require only, enabling them to share relevant data and insights within those
teams.
Last week, we looked
at creating queries using our datamart. This
week, we’ll show how to create reports.
Power BI
automatically produces datasets for use in downstream reporting when datamarts
are established. Reports may be created
from these automatically created datasets.
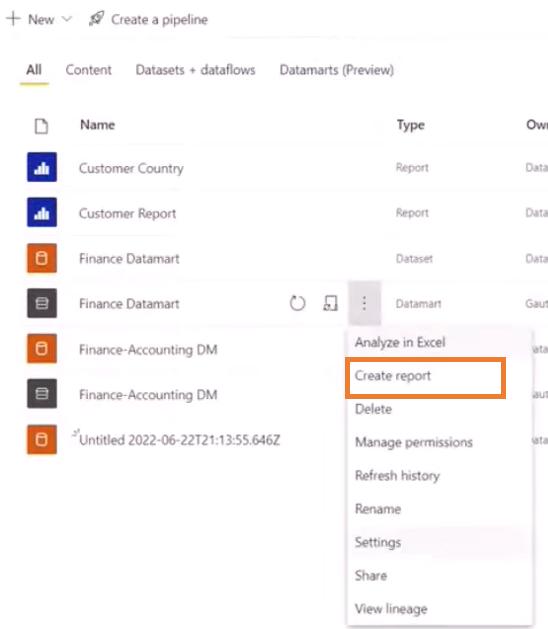
To create a report, within the appropriate workspace, select the ellipsis
icon next to the datamart. In the menu
that appears, choose ‘Create report’.
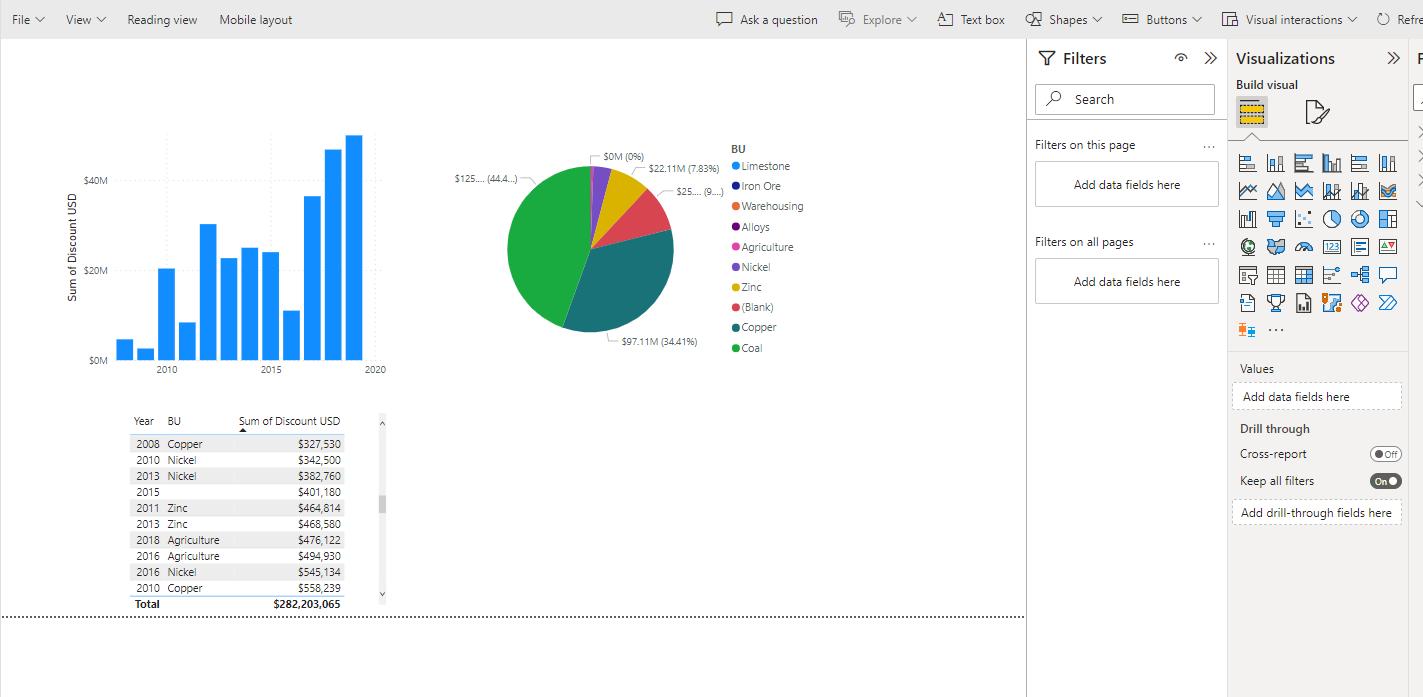
This feature allows
us to create report in the same way that we would from Power BI Desktop. We can drag and drop measures and fields to create
charts, matrices and cards and create interesting content from the datamart by
using the associated dataset.
Check back next week for more Power BI tips and
tricks!
Be the first to comment