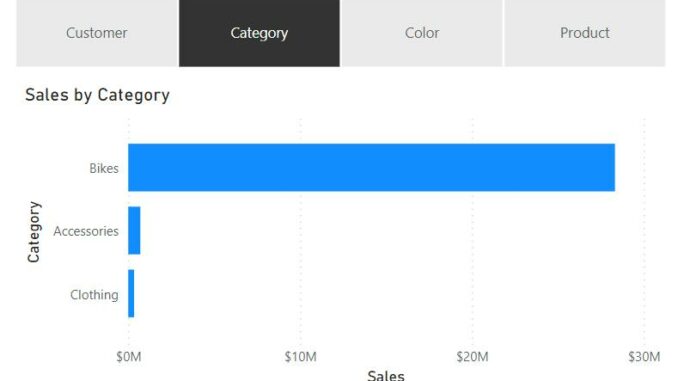
Welcome back to this week’s edition of the Power BI blog series. This week, we look at a new feature enabling you to dynamically change measures and / or dimensions.
There’s a new Preview feature called field parameters that will allow users to dynamically change the measures or dimensions being analysed within a report. This feature can help you explore and customise the analysis of the report by selecting different measures or dimensions of interest.

In order to create a field parameter, you will need to first enable the Preview feature called ‘Field parameters’:

Then, to create a new field parameter, you will need to navigate to Modeling -> New parameter -> Fields:

To build the parameter, you will need to provide a name for the parameter and select the fields you want to use. In this example for a field parameter, we’ve selected different dimensions:

In this dialog, you may drag and drop to change the ordering of the fields or double click on any of the selected fields to change the display name. You may also mix and match different measures and dimensions within the same parameter. For example, this feature can be used to create a dynamic table, whereby the columns may be either measures or dimensions.
Once you’ve created a field parameter, you can now use the parameter to control the measures or dimensions used in a visual.

You may use the parameter in the field drop zones for a visual. Note that certain visual properties have restrictions on the number of fields that may be used or the types of fields that can be used.
From within the context menu, you can also change whether the field parameter is showing the values of the selected field(s) or the display names of the selected field(s) for all non-slicer visuals, viz.

Finally, if you need to edit any existing field parameters, you will need to modify the DAX directly. For example, if you want to add a new field to an existing parameter you can click SHIFT + ENTER to start a new entry:

You’ll need to add a comma between each entry, and you will need to match the following format:
(“<display name of choice>”, NAMEOF(‘<table name>’[<field name>]), <ordinal number used for sorting>)
There are some limitations:
- AI visuals and Q&A are not supported with the feature
- there is no way for end users to select ‘none’ or no fields option. This is because selecting no fields in the slicer or filter card is the same as selecting all the fields
- you cannot use implicit measures for now, meaning if you need an aggregated column as one of your fields, then you would need to create an explicit DAX measure for it
- example of implicit measure: ∑ Sales
- example of explicit measure: Measure = SUM(‘Table’[Sales]).
Check back next week for more Power BI tips and tricks!

Be the first to comment