

Welcome
back to this week’s edition of the Power BI blog series. This week, we look the Narrative Visual with
Copilot – an update to the well-liked Smart Narratives.
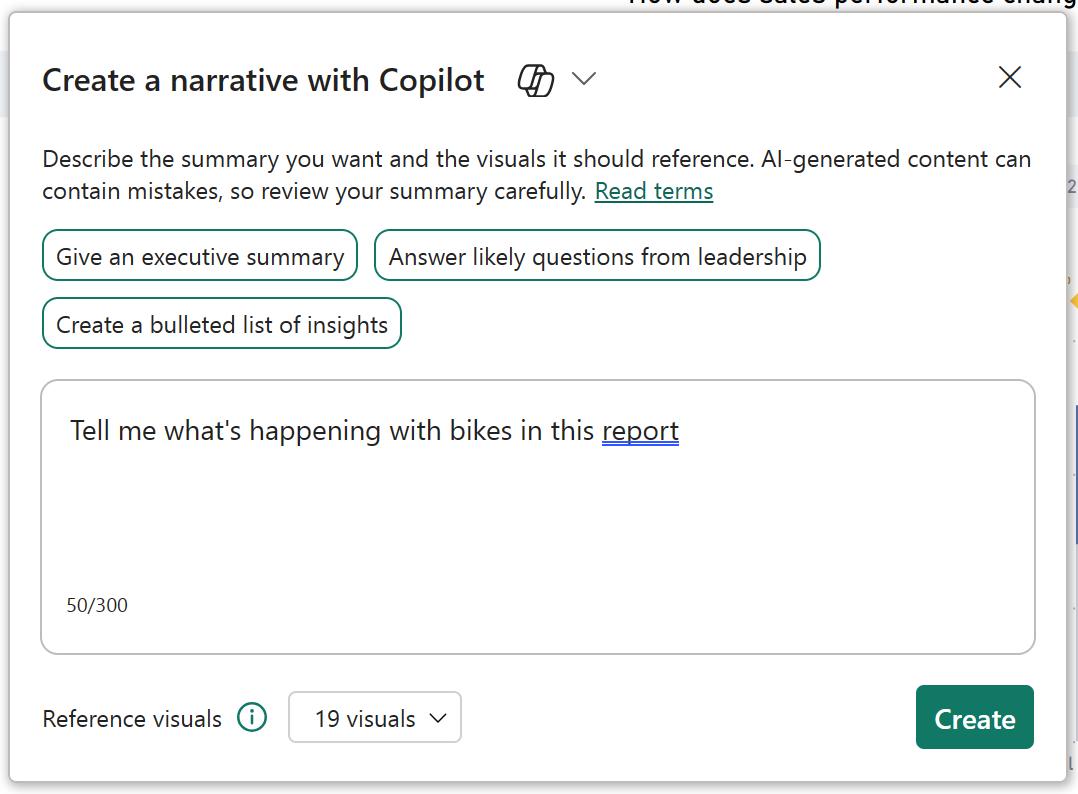
Copilot’s ability to summarise data has
now been exploited to the rebranded ‘Narrative with Copilot’ visual – formerly
‘Smart Narratives’. This visual allows
you to use Copilot to summarise data across your report or even specific pages
or visuals you choose. Power BI offers
suggested prompts to get authors started, such as “Give me an executive
summary”, “Answer likely questions from leadership” and “create a bulleted
list of insights”. Users can also type
in their own custom prompts and questions that return summaries about their
data.

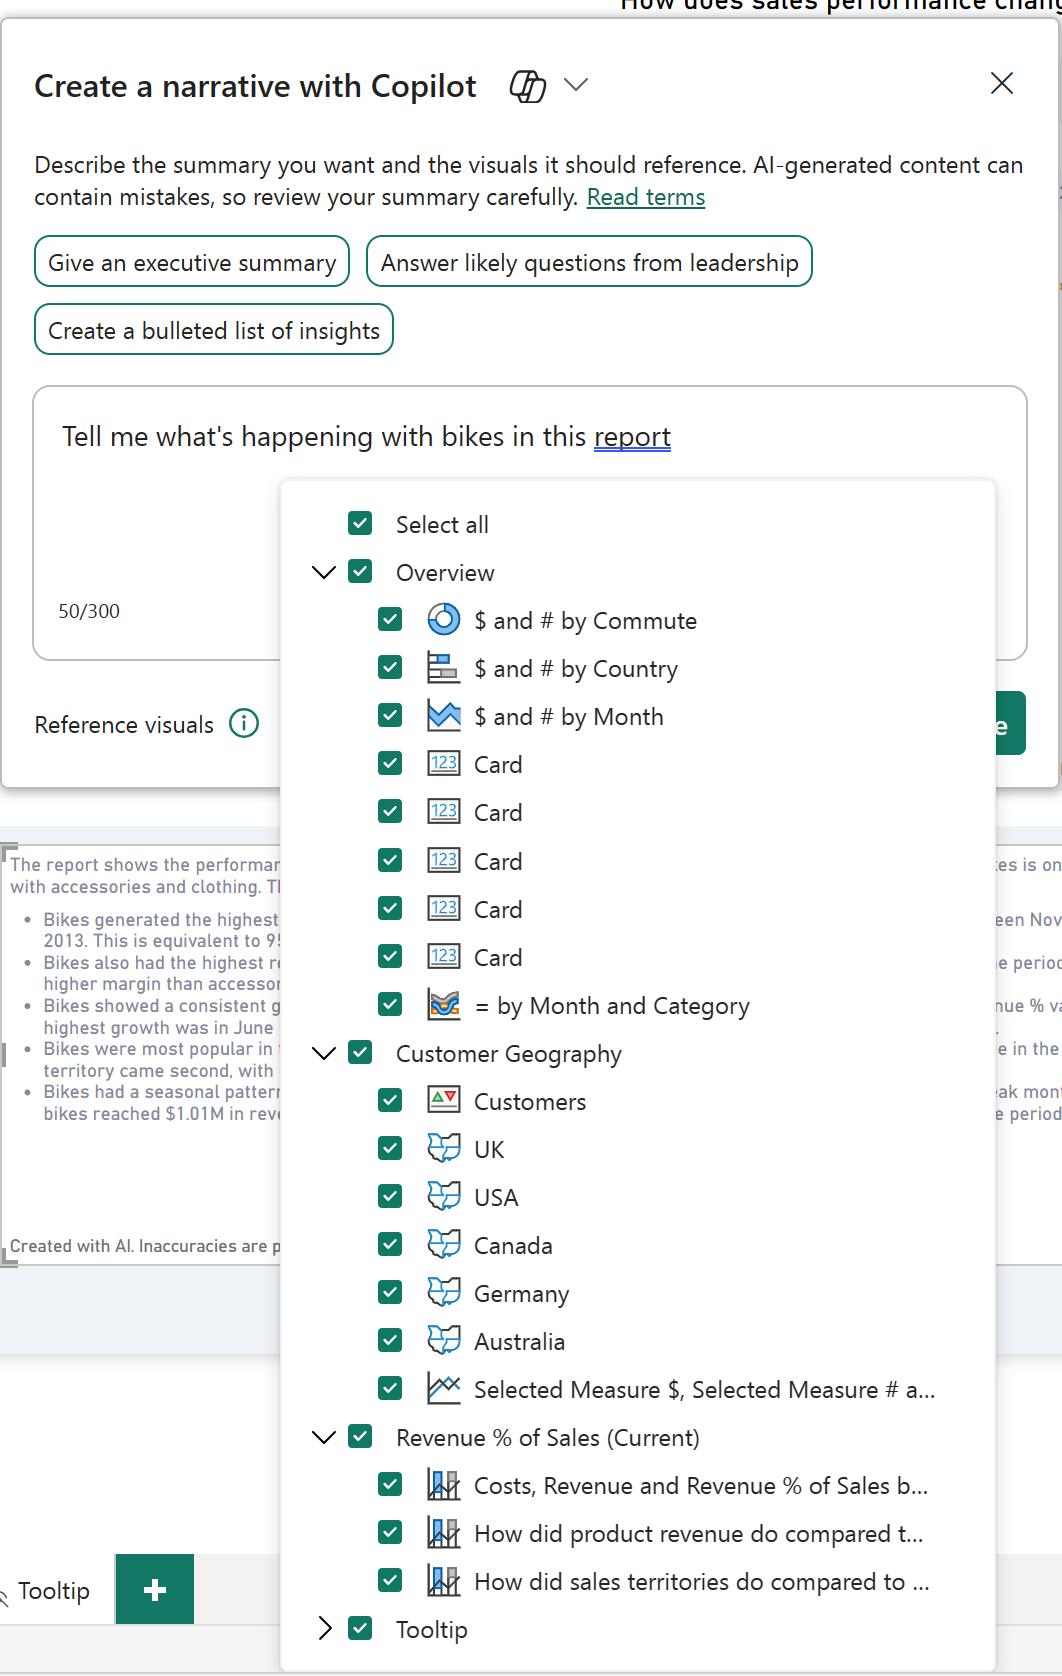
Users have the ability to choose
whether they want to summarise over the entire report, select pages or even
specific visuals across their report, giving them flexibility in what their
summary looks like. Users will also see references
for each portion of the summary that align to visuals on the various pages on
the report, from which the summary lines were generated, making it easy to
validate the summary’s accuracy and tie it back to the data.
The summary can be updated as the data
is sliced and diced, so end users may interact with it, without editing the
prompts themselves. This narrative
visual with Copilot makes it faster to communicate insights about the data that
matters to you. The visual is available
in the Service and in Power BI Desktop.

Be the first to comment