

Welcome back to
this week’s edition of the Power BI blog series. This week, we look at Optimize Ribbon.
Power BI has just
introduced two key features to help you customise your Azure Maps visualisation
to better suit your needs.
Controlling Data
Labels in the Base Map
As we all know,
Power BI keeps improving all the time.
Recently, Microsoft has announced the public Preview of the Optimize Ribbon
in Power BI Desktop. This is an entire Ribbon
devoted to making an end user’s experience authoring reports streamlined,
especially in DirectQuery mode.
If you have ever
wanted to stop visuals from loading data while you are still making changes, or
wanted to edit multiple DAX measures without updating the report canvas
in-between those edits, or wanted to take full control over when visuals
refresh, then ‘Pause visuals’ is for you, for example.
‘Pause visuals’ provides
you with control over when visuals send out DAX queries. Now you may make your edits undisturbed. Simply update your visual when you are ready. Moreover, the new Optimize Ribbon makes it
easy to find the right report settings you need for DirectQuery reports. Now you can find and apply Optimization
presets with only a few mouse clicks. The Optimize Ribbon is a significant step
towards streamlining the DirectQuery report authoring experience.
In summary, the
authoring tools on the Optimize Ribbon provide you with the following
capabilities:
- fully
control when visuals refresh. Switch to the Optimize Ribbon, click on ‘Pause
visuals’, as in the below screenshot, and from now on visuals will no longer
refresh automatically. Click on ‘Refresh
visuals’ when you are ready for visuals to run their queries and update their
data
- quickly
choose and apply predefined combinations of settings tailored to your reporting
needs. No longer are you limited to default settings
in Power BI Desktop, as you may quickly choose and apply settings tailored to
your reporting needs with Optimization presets. Click the drop down on ‘Optimize presets’ to
choose between full interactivity, full query reduction or customise to find
the perfect balance for your report
- conveniently
launch ‘Performance Analyzer’ to analyse the queries your report visuals
generate. Easy access to important performance optimisation
tools goes a long way to boost report author productivity. The Optimize Ribbon is now your one-stop shop
to the tools to create optimized experiences for your report users.
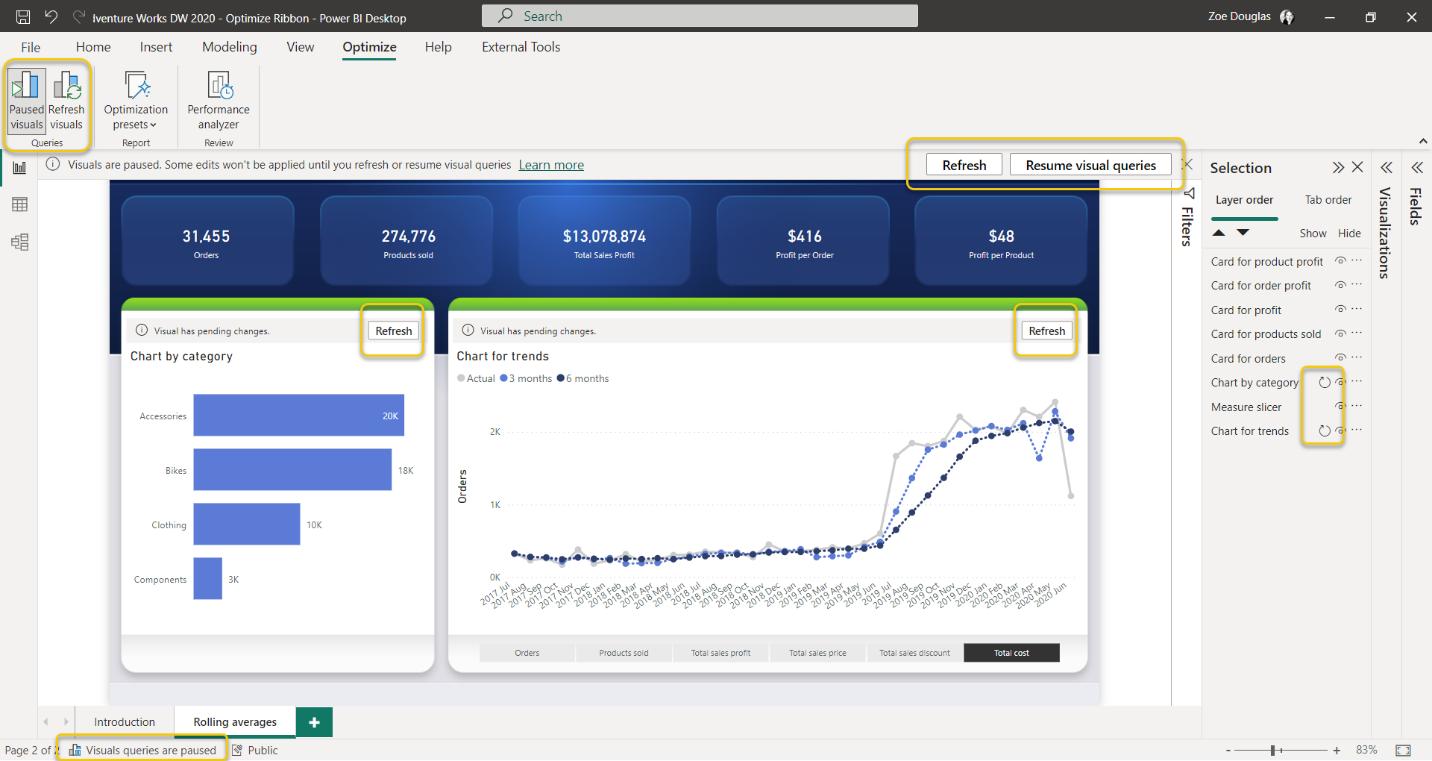
The above screenshot
shows you the Optimize Ribbon in action. It is now available in Power BI Desktop. Just keep in mind that you need to enable the
Optimize Ribbon explicitly. As a Preview
feature, go to Files -> Options and Settings, then click on Options,
select Preview features, and then select the ‘Optimize Ribbon’ checkbox.
In the meantime, please remember we offer training in Power BI which you can find out more about here. If you wish to catch up on past articles, you can find all of our past Power BI blogs here.
Be the first to comment