

From the Desk of Alfonso Depablos @Alfcharts
The stock market has been under duress for the past two months as bears have taken control and driven the major averages to their lowest levels since early June.
Whether you look at the large-cap indexes or the strongest sectors and industry groups, they are all stuck below overhead supply.
And with price action continuing to deteriorate, many of these charts are now carving out potential short-term tops.
Here’s the S&P 500 $SPX retracing back to the 4,300 level and threatening to complete a short-term reversal pattern.
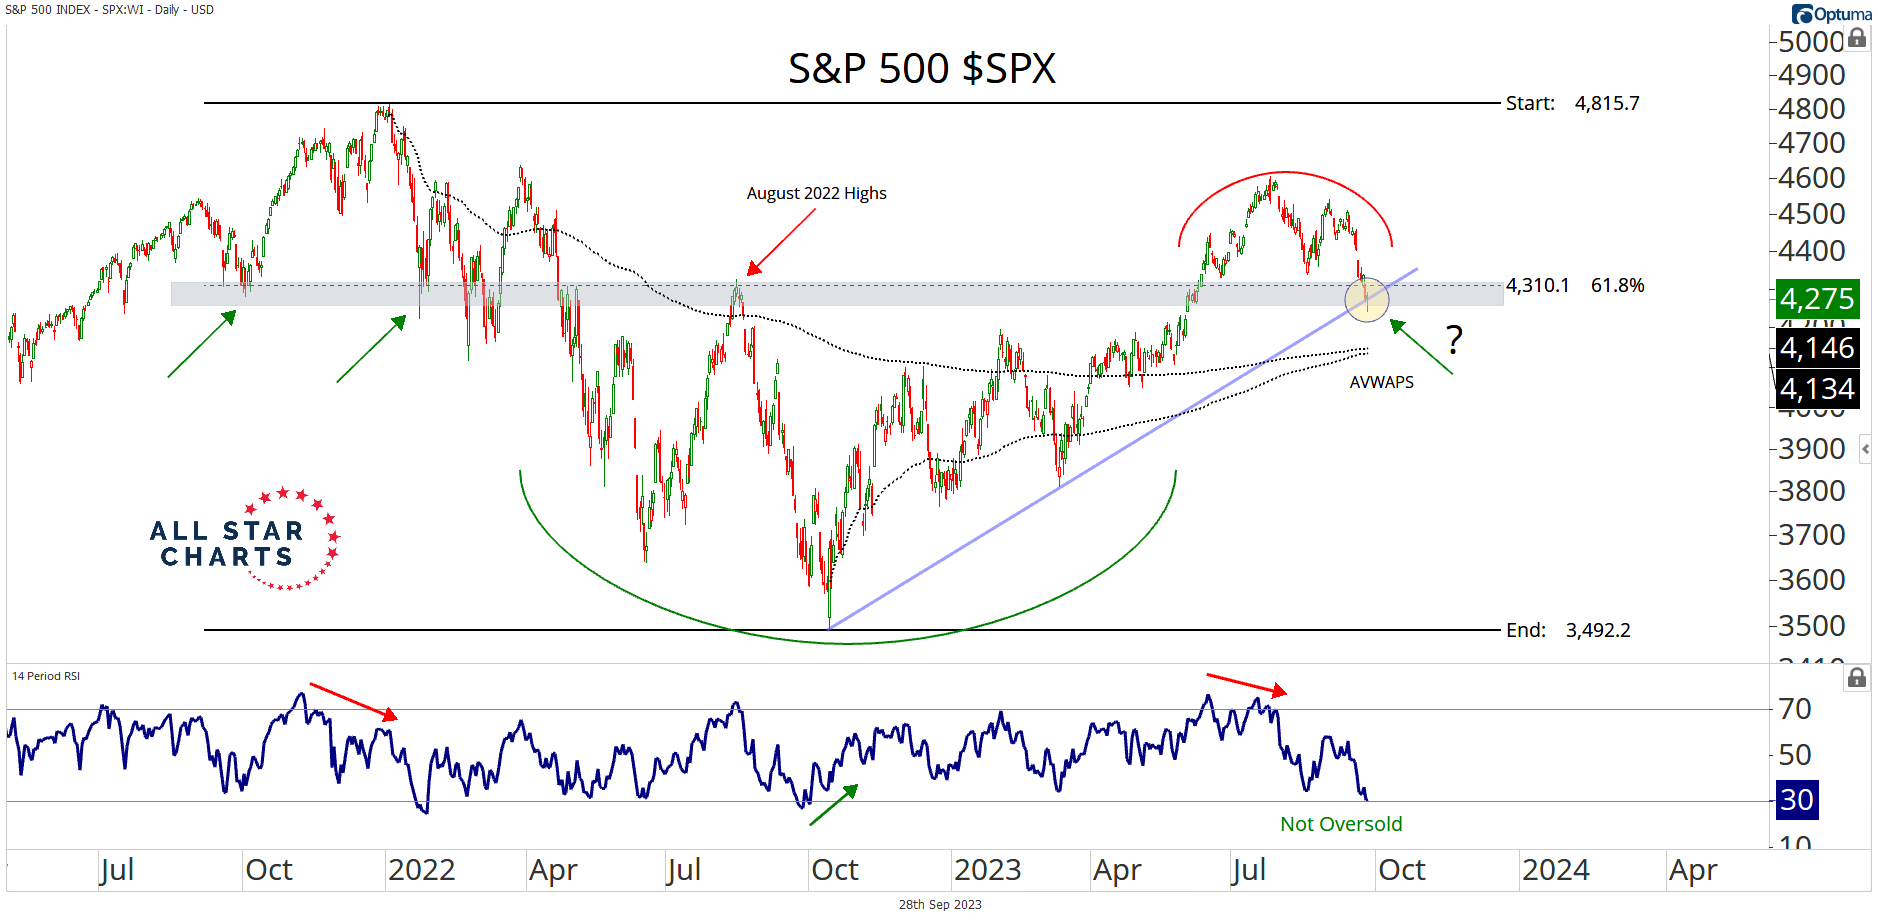
The S&P has returned to a critical polarity zone marked by former resistance at the August 2022 highs and the 61.8% Fibonacci retracement of the bear market decline. It is also testing the trendline off last year’s lows, making for a confluence of potential support at current levels.
But, it doesn’t just end there. The AVWAPs from the all-time high and last year’s lows come into play around 4,130 and 4,140. This could be the last line of defense preventing a retest of last year’s lows.
Taking a look at the 14-day RSI shows that although momentum has been waning, it hasn’t reached oversold conditions… yet.
We couldn’t think of a more logical place for bulls to step in and halt the recent sell-off. Tops like these fail all the time. They are some of our favorite patterns.
However, if price violates this crucial area of interest, be prepared for further downside and increased volatility.
We hope you enjoyed this post.
As always, we love to hear from you, so shoot us a note and let us know what you think.
Alfonso
Be the first to comment