
In this tutorial, you’ll learn about the queueing capability of DAX. You’ll learn how to use it to load data from the SQL Server Analysis Services (SSAS) to Power BI.
In this example, a SQL Server data model has already been created. It contains tables for the Customer, Dates, Products, and Sales data.
You’ll learn how to write a DAX code that loads the data inside the data model in Power BI.
The DAX Code
Launch DAX Studio and create a measure. Use the DEFINE keyword and declare a MEASURE for the Total Sales. Then, use the SUMX function. For its row context, multiply the quantity by the net price.
To ensure that you’ll return small values, divide the sales amount by 10,000. Place the SUMX argument in an INT function to remove decimals.

Create another measure for the running total. Declare a variable using the VAR function. This will hold the last visible date in the filter context. The last visible date is equal to the MAX of the Date.
Even if you don’t have a Dates table in the Power BI data model, you’ll still be able to access the filter context using the SSAS version.
Create another variable that shows the result. This will CALCULATE the Total Sales. Use RETURN to show the result.

To visualize the result in Power BI, use EVALUATE and the SUMMARIZECOLUMNS functions. You need to use the Calendar Year Number and Month. To ensure that the data is sorted in the correct order, use the Month Number column. Then, create columns for the Total Sales and the Running Total.

Next, use the ORDER BY clause to make sure that the resulting table sorts the data correctly. Use the ASC order for both the Calendar Year Number and Month Number columns.

The SSAS Database Window In Power BI
Copy the finished DAX code and go back to Power BI. Go to the Home tab, click Get Data, and then Analysis Services. This will open the SSAS database window.
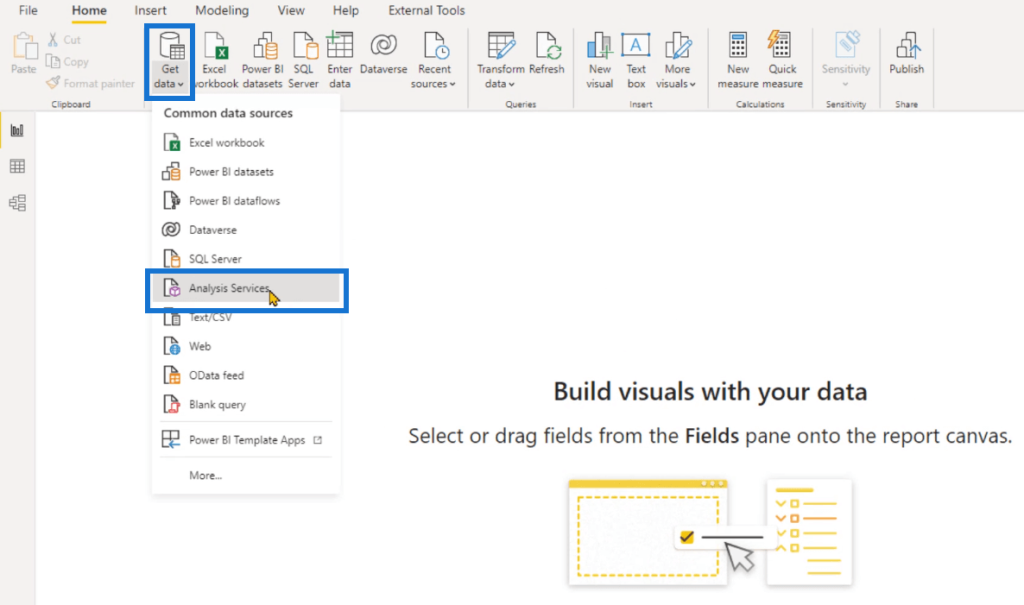
Specify the name of the Server and the Database. Then, click the Import option. In the MDX or DAX query textbox, paste the DAX Code. Afterwards, click OK.
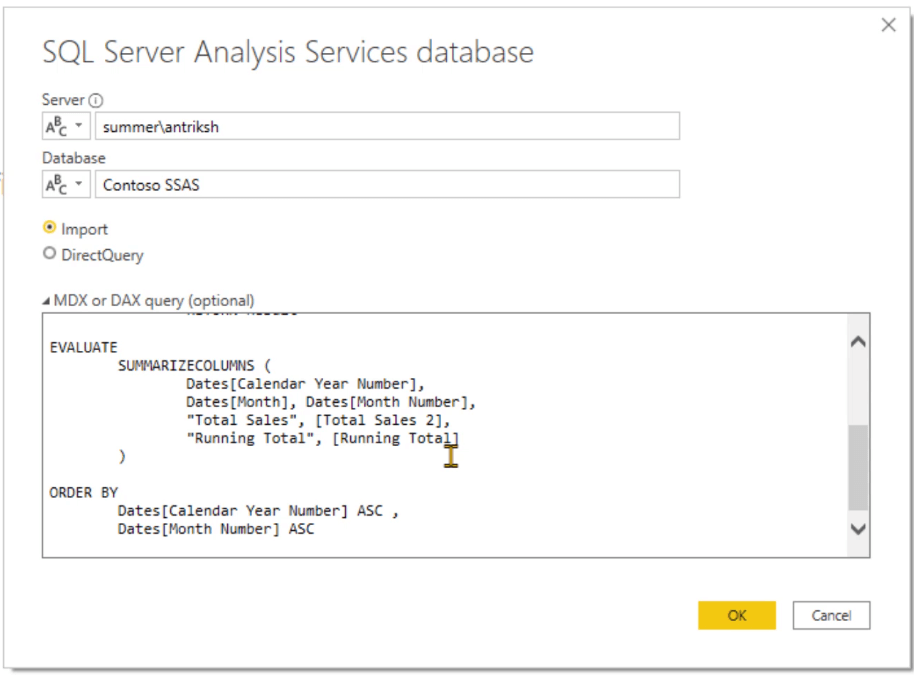
You’ll see that you can get the dataset from the DAX query.
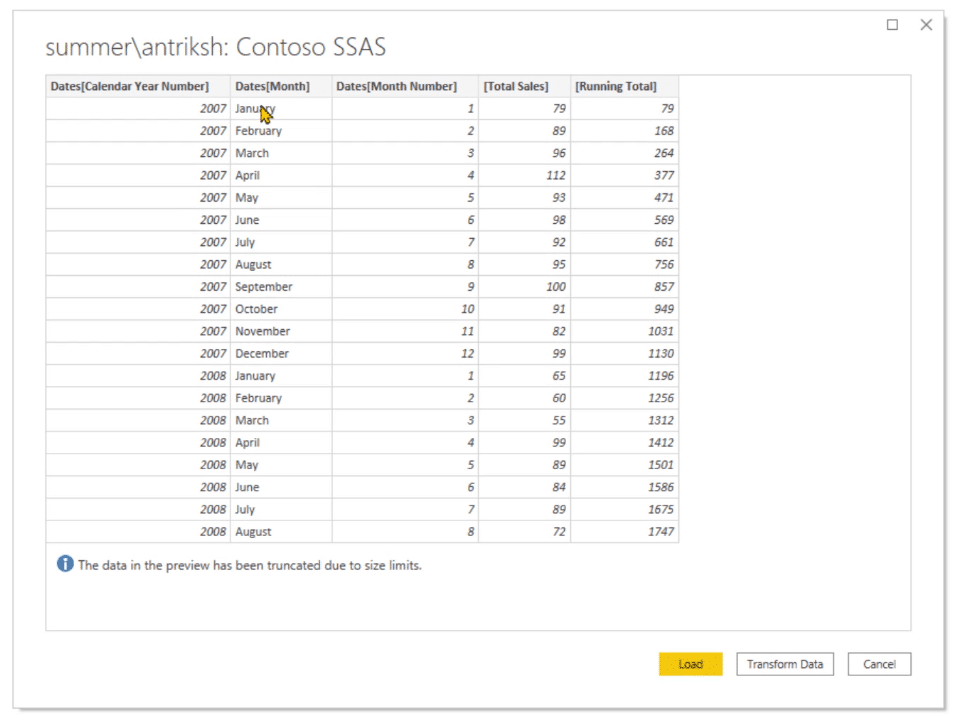
Clicking on the Transform Data button opens the Power Query editor. This allows you to modify the column names and perform other formatting options on the data table.
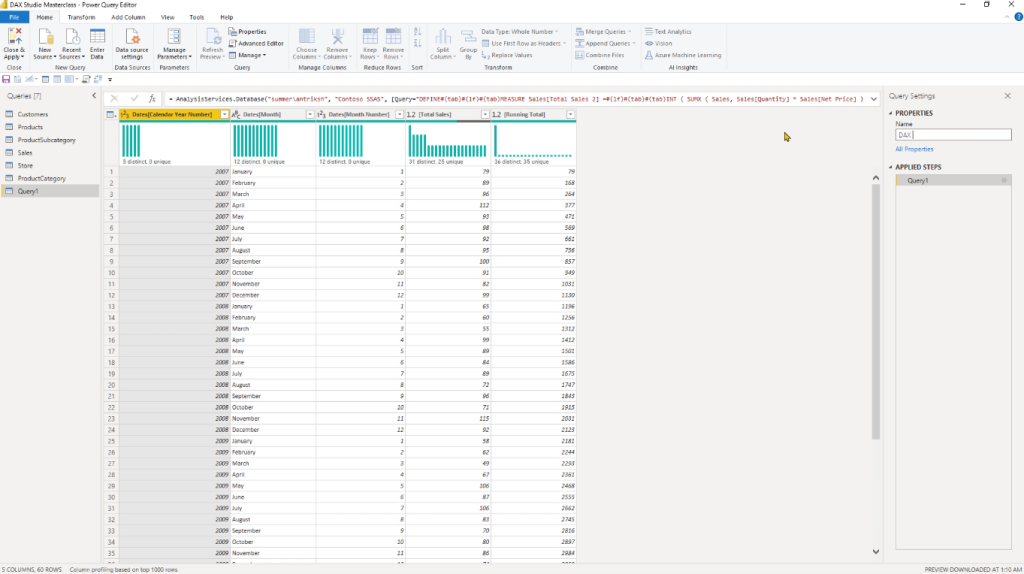
When you click Load, you’ll see the table in the Data View.
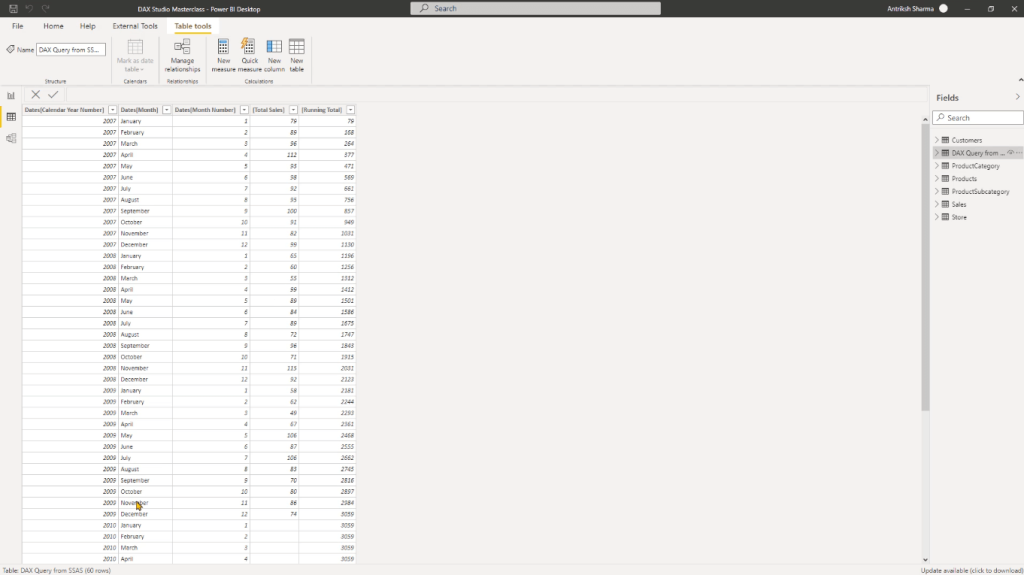
You can see that you’re returning 60 rows which consist of one row for each month of the year.
***** Related Links *****
How To Load Sample Datasets In Python
PowerApps Data: How To Upload And View Data In Entities
Data Loading And Transformation Best Practices
Conclusion
This tutorial gave a brief example on how to load from the SQL Server Analysis Services to Power BI. You’ve learned that loading the data and executing it against the deployed version of SSAS is an easy process. Once you’ve mastered the basics, it will be easier for you to retrieve data from any database in Power BI.
Enterprise DNA Experts

Be the first to comment