

From the Desk of Ian Culley @IanCulley
Price must hold above key support levels when defining a range or uptrend.
It might sound simple. Yet investors often sideline these crucial levels in favor of the latest headline.
I read the news daily and support journalists fighting the good fight. However, I don’t incorporate what I read in the papers into my market analysis.
Instead, I focus on price and the critical areas seared into the collective memory bank – support and resistance.
Perhaps you can guess my response when a reader recently asked, “What will it take for crude oil to break down?”
Price must undercut support!
Check out the daily crude oil chart:
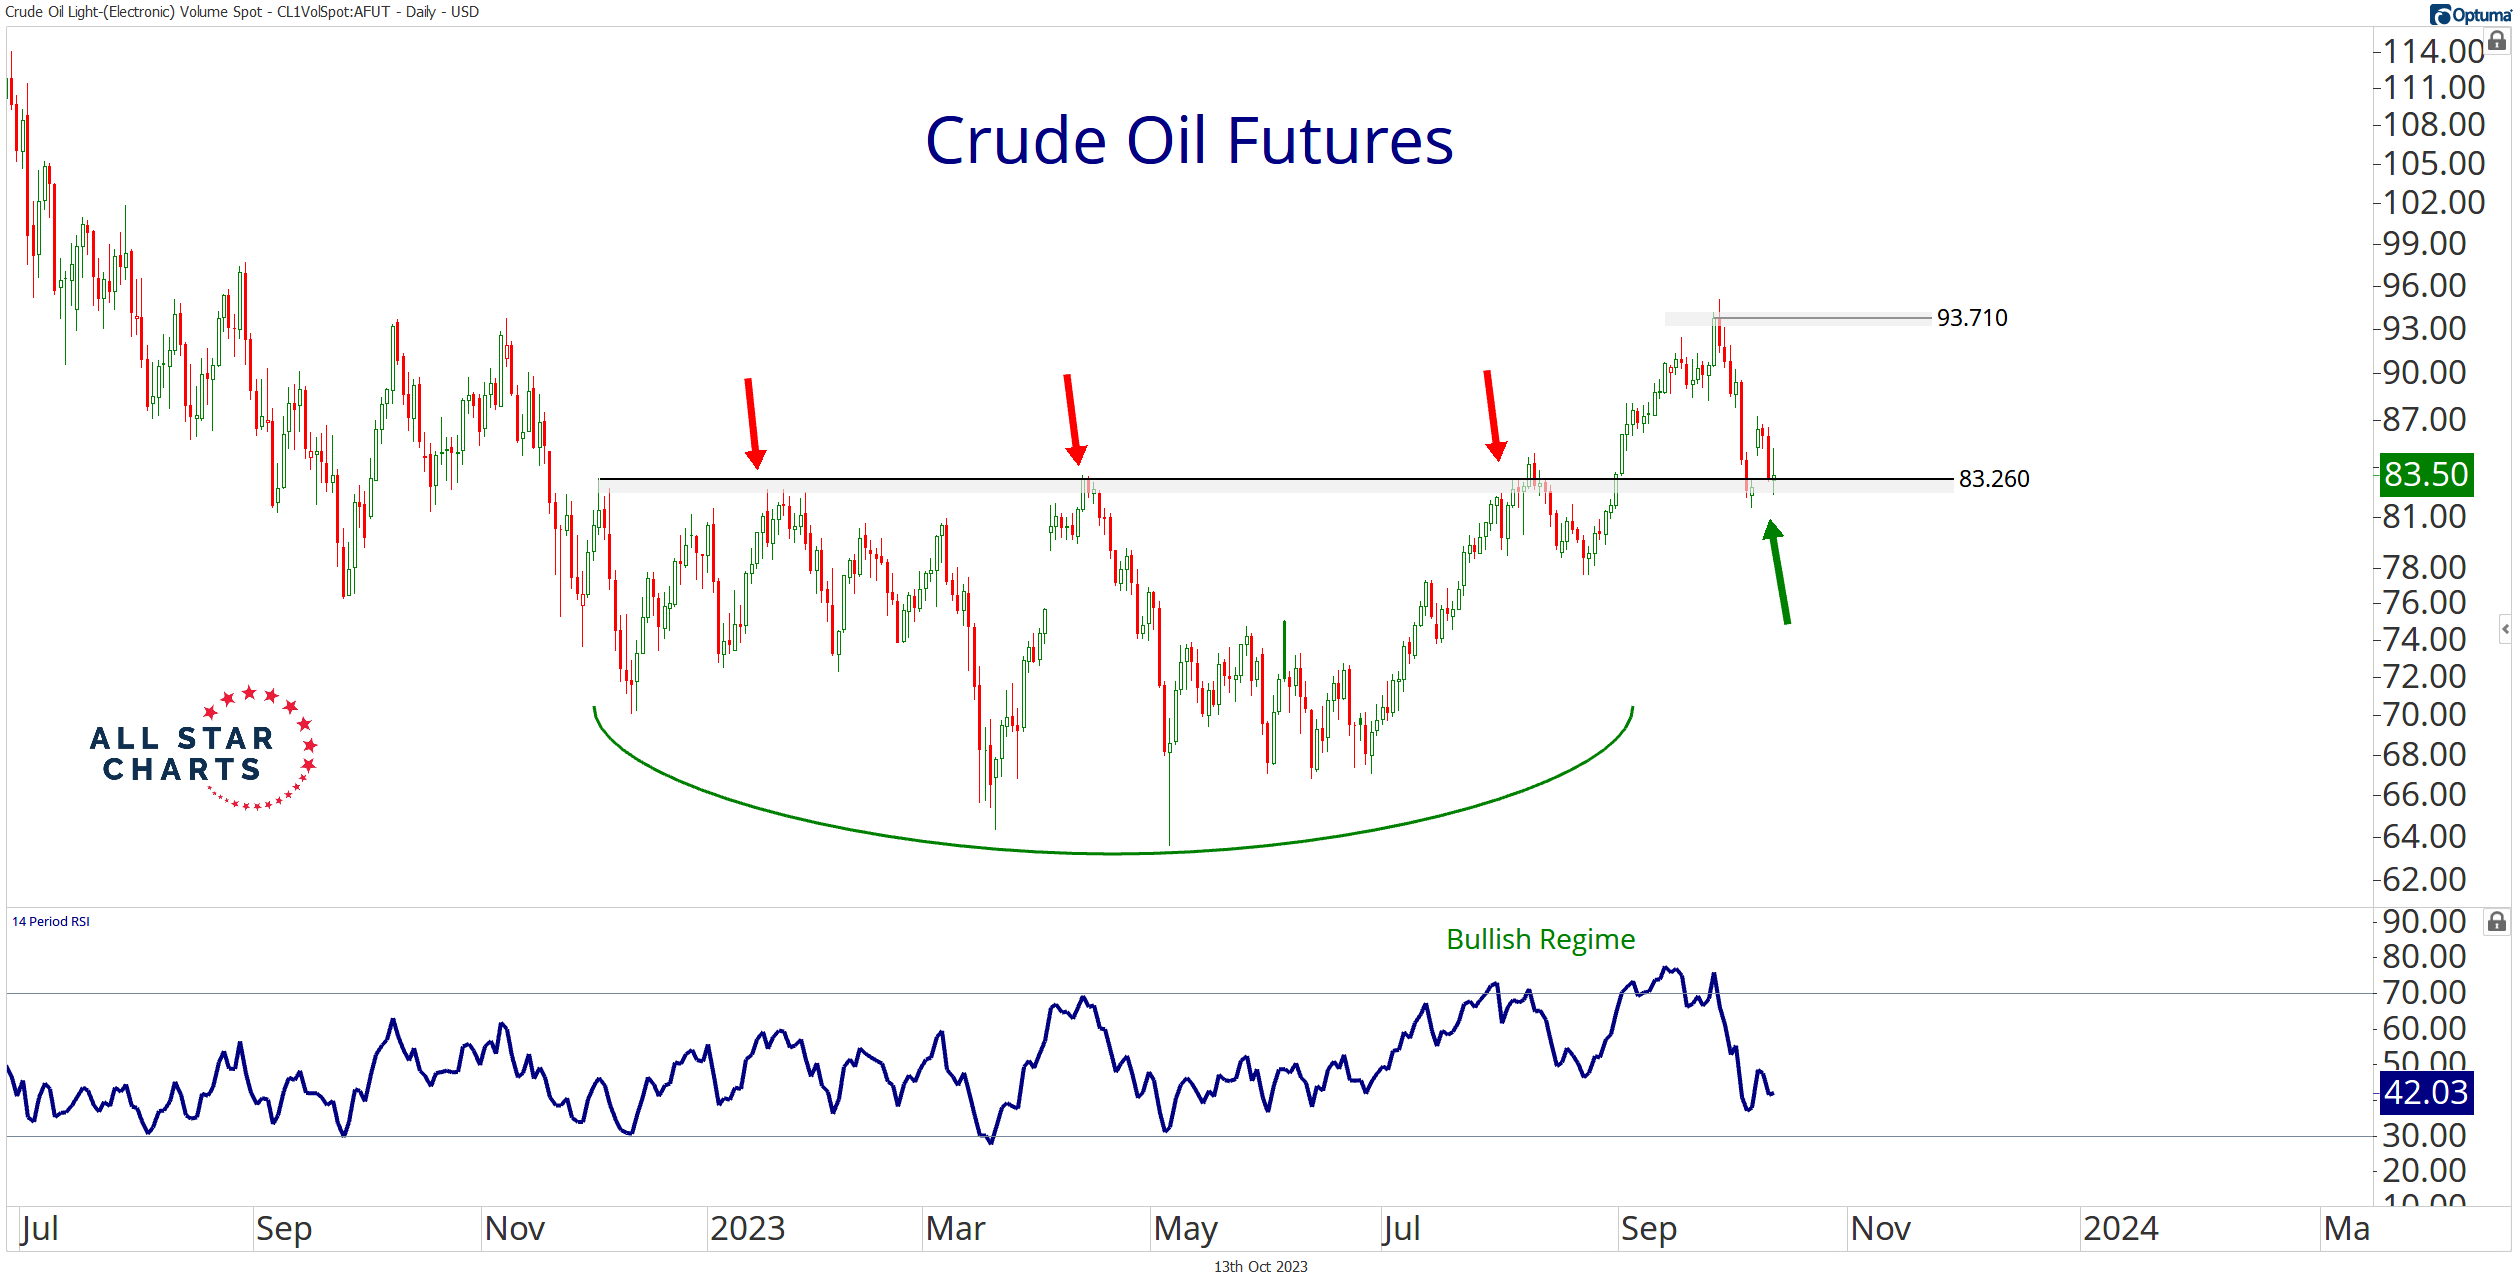
The principle of polarity unfolds as former resistance turns support at approximately 83.25. That’s the level.
It’s difficult to hold a bearish outlook for crude or energy as long as buyers defend this key area.
Is the crack spread rolling over, indicating a weakening demand for crude distillates and, by extension, crude oil? Yes.
Has the Energy Sector ETF $XLE, gasoline, and heating oil futures failed to resolve higher from their year-to-date ranges? Yes.
The energy space has plenty of work to do, including crude oil.
But crude deserves a chance to dance after marching higher for three straight months!
Let’s give it a little room…
The new range for crude: $83 – $94.
The world has certainly changed since last week – no question. But as always, change is the only constant.
I haven’t witnessed any significant shifts in overarching market themes – such as the US dollar and interest rates – to the extent of wavering my outlook for crude or energy.
My bias will no doubt turn at some point. And I will embrace those revisions when the data supports it.
Until then, crude oil deserves the benefit of the doubt.
Stay tuned!
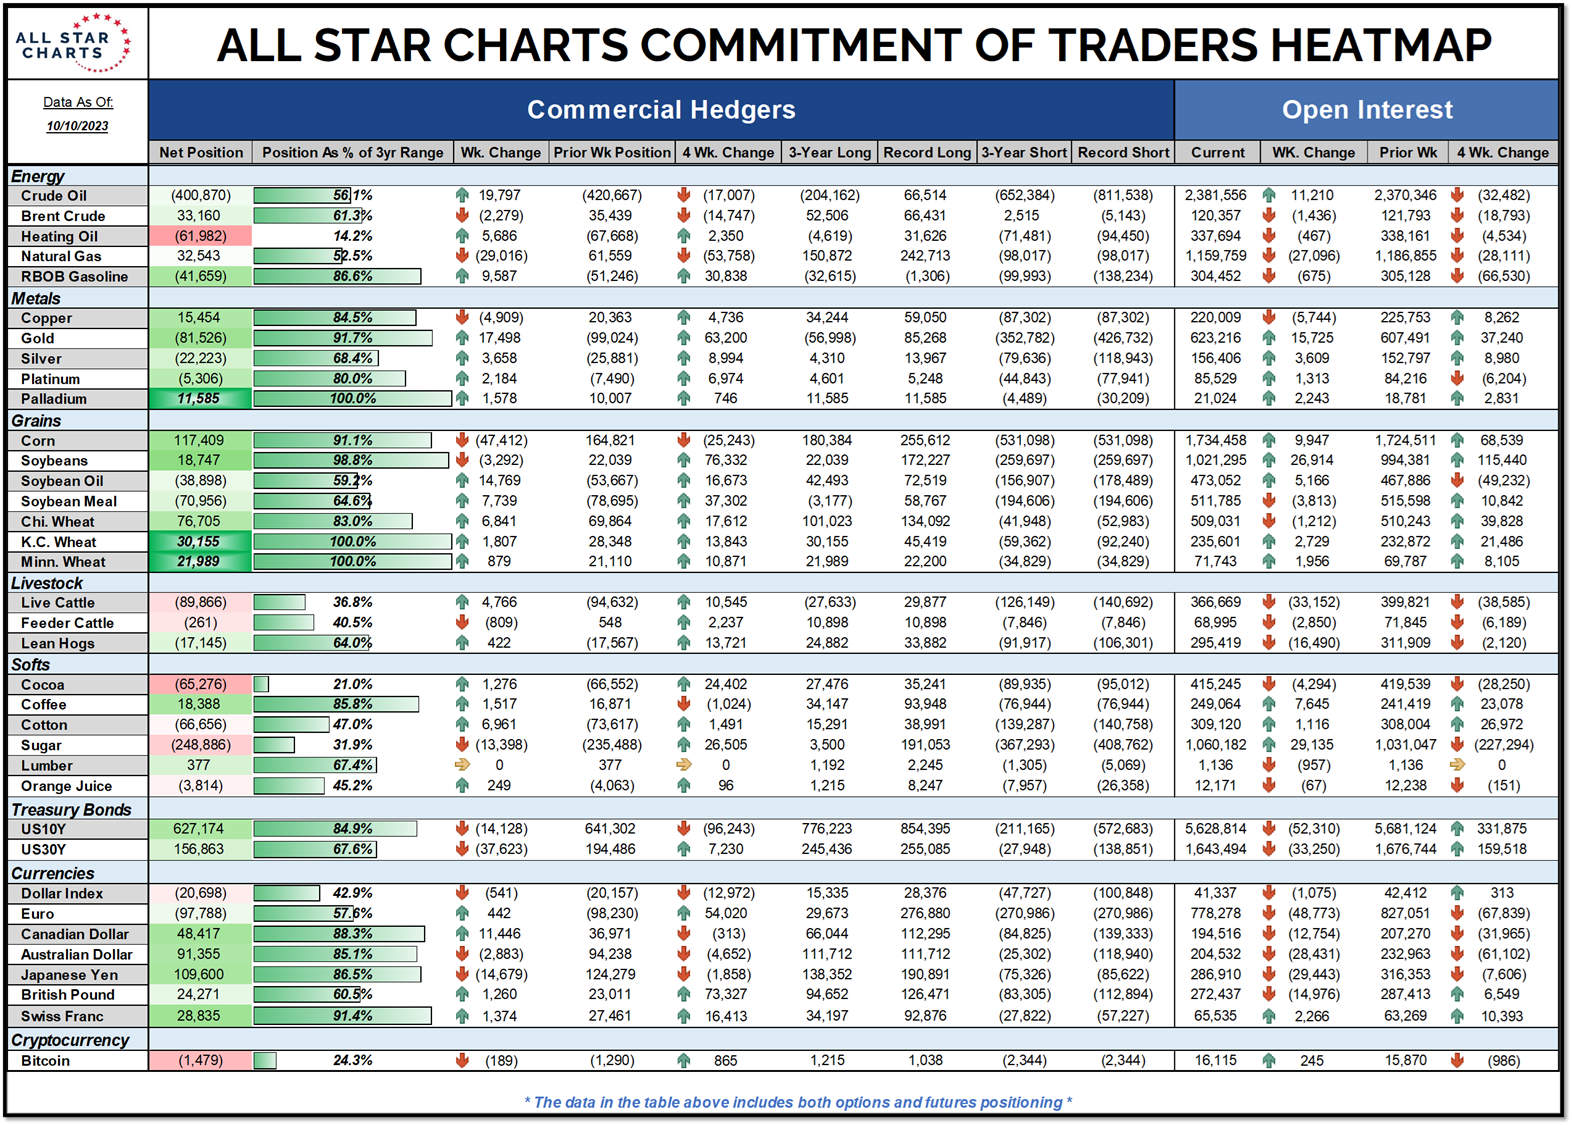
COT Heatmap Highlights
- Commercial hedgers hit another record-long position in palladium.
- Commercials are within eight percent of their most significant long exposure to the Swiss franc in three years.
- And commercials hold three-year extreme net-long positions for Minneapolis wheat and KC wheat for the second week.
Click here to download the All Star Charts COT Heatmap.
Premium Members can log in to access our Weekly Commodities Report Chartbook and the Trade of the Week. Please log in or start your risk-free 30-day trial today.
Be the first to comment