

One of the things we’ve been monitoring closely over the past month is the new lows list.
I see very often how people love to just subtract random numbers from each other, mostly for the sake of subtracting.
There’s really no reason for it.
For example, lately I’m sure you’ve noticed some traders and analysts taking the new 52-week high list and then arbitrarily subtracting the number of new 52-week lows from it.
lol for what?
There’s nothing happening in the new 52-week lows list. The stock market was making new all-time highs just a minute ago.
The time to be looking at the new 52-week lows list was in the summer of 2022, when it stopped getting longer.
By the time the S&P500 made its final low in October of 2022, there were hardly any stocks left still going down. You could see it in the new 52-week lows list.
The list not worth watching yet, at that time, was the new 52-week highs list. There wasn’t anything going on there in 2022, just like there’s nothing happening in the new 52-week lows list today.
I’ve found it much more helpful over the years to take a look at one list at a time, on an absolute basis, and to understand when to look at which lists.
The new 52-week lows list today is non-existent. A slight change from day to day is not going to be meaningful. So we ignore it.
Rather than subtracting random numbers from each other (e.g. new highs minus new lows), we just want to look at the new highs. And then we’ll look at the new lows.
As we’ve discussed at length, there isn’t much happening in the new 52-week highs list. It peaked 2 months ago.
But while the new 52-week lows list is also non-existent, we’re much more interested in the shorter-term new lows.
And what has stood out to me is the lack of new lows, even in the most short-term of timeframes.
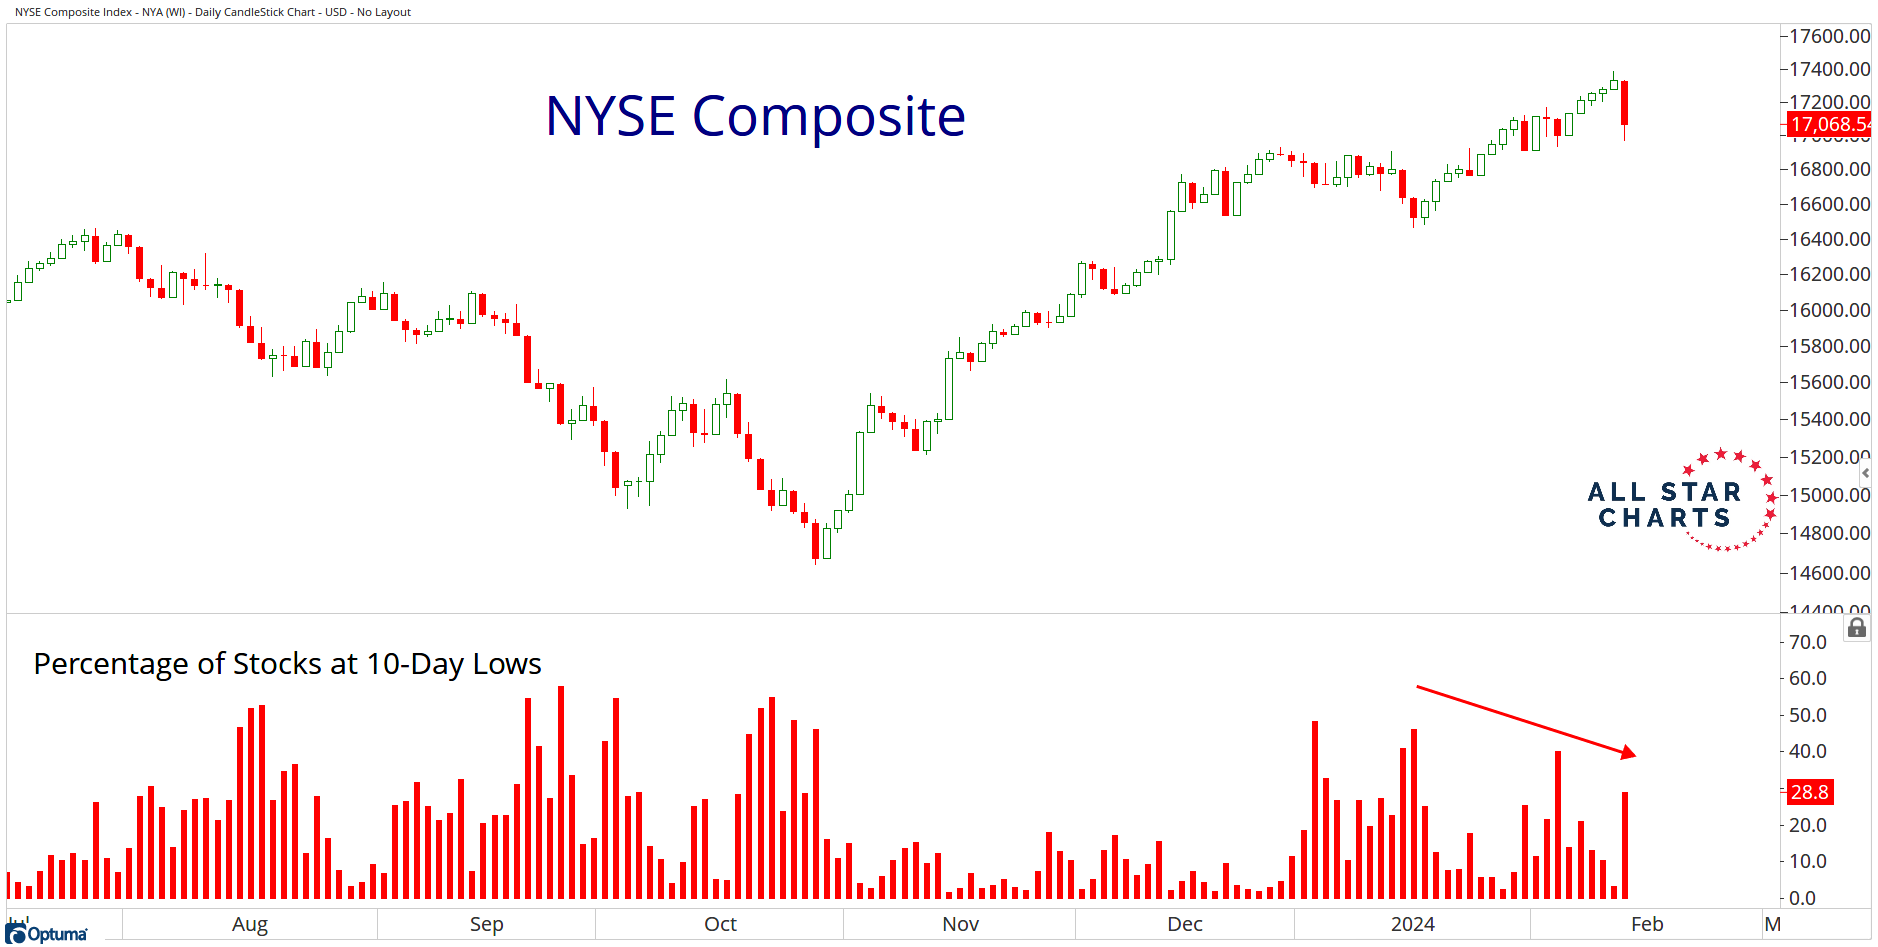
Look at the list of new lows on the NYSE, for example. While we’ve certainly been seeing the new highs list getting shorter, we still haven’t seen the new lows list getting longer:
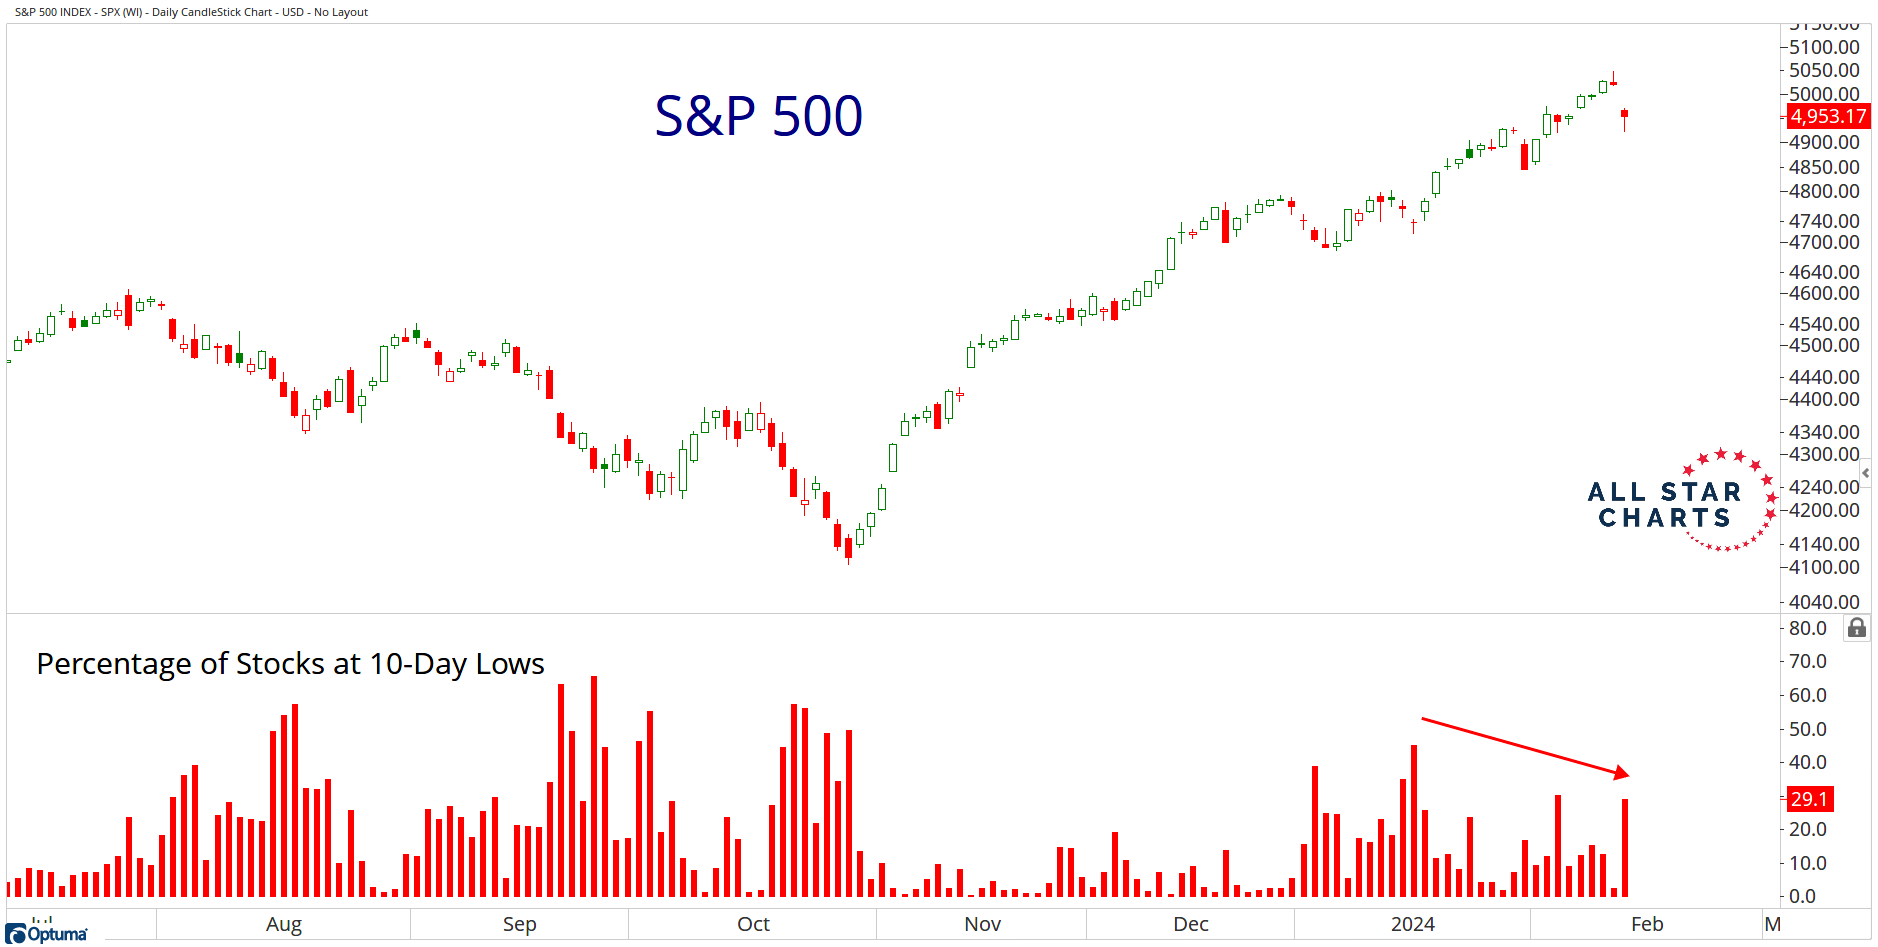
It’s the same thing in the S&P500.
The new lows list, even in the most short-term of timeframes, is still not expanding:
You can’t have a severe decline in the market without an expansion in new lows. That’s just math.
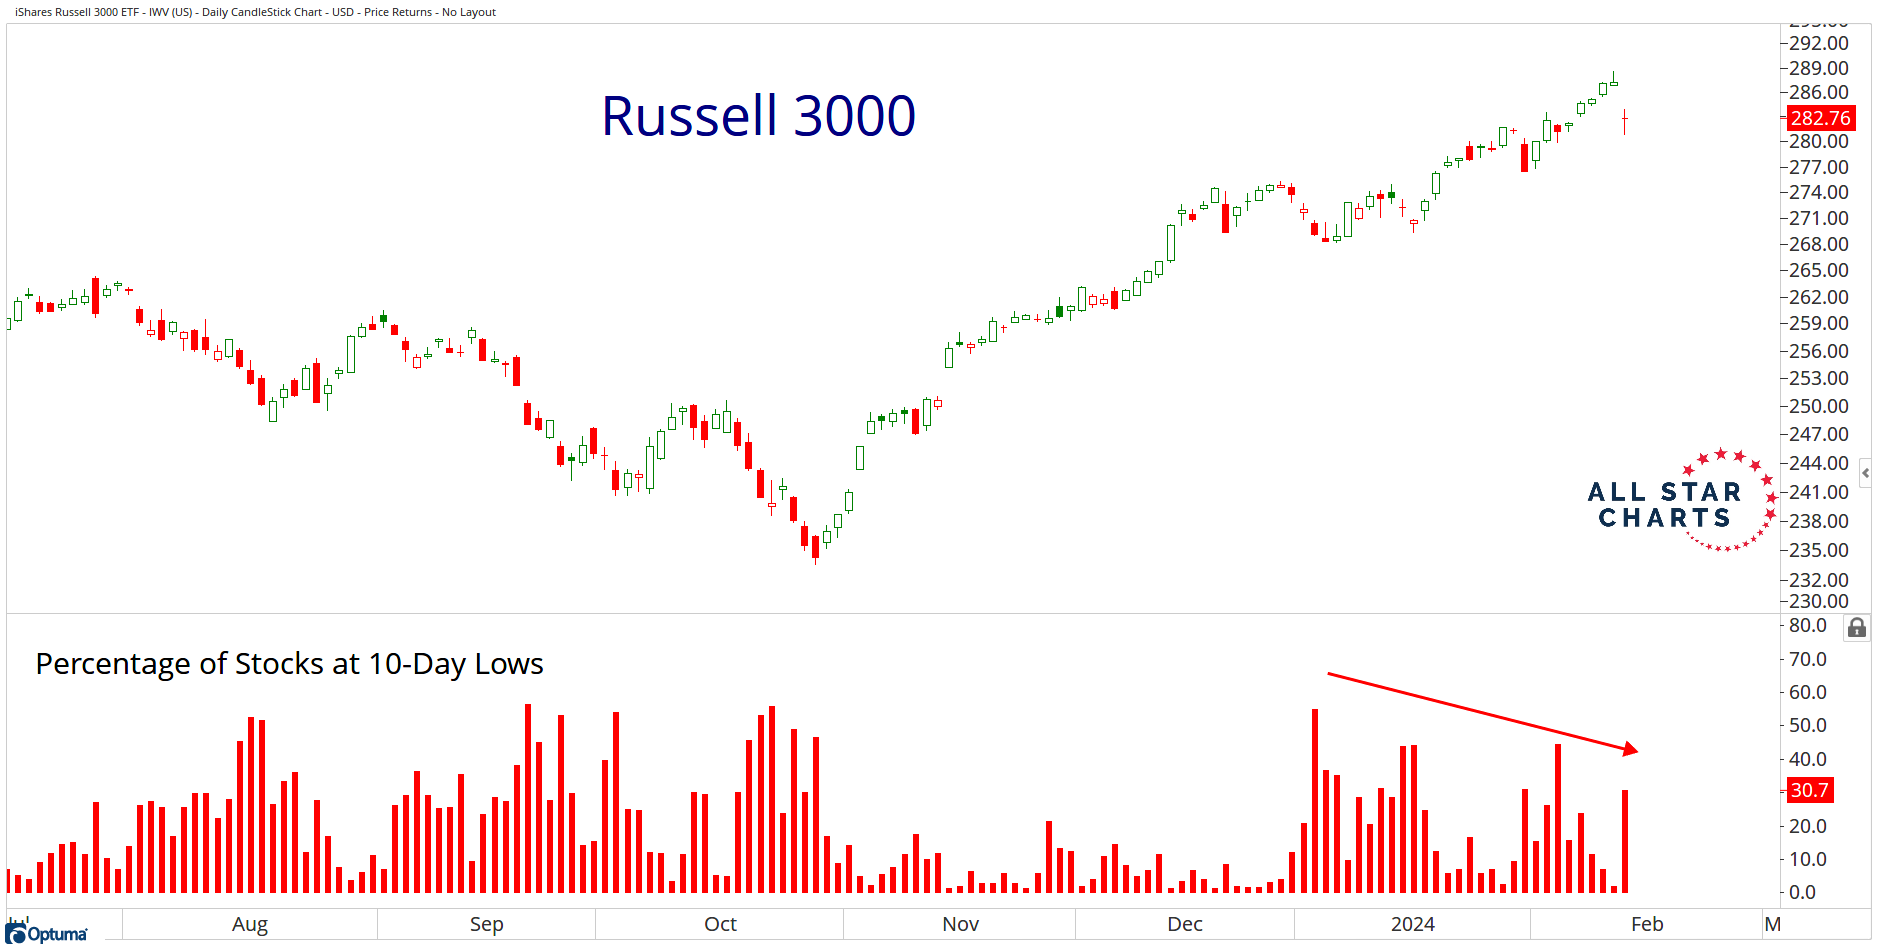
Look at the Russell3000, which represents approximately 98% of all investable assets in the US Equities market.
No expansion in new lows, yet.
You guys know me by now.
I don’t care either way.
The S&P500 can go to 10,000 and I’d be cool with that.
The S&P500 can go to 1,000 and I’d be cool with that.
I’m too old to give a damn anymore.
When I was a lot younger I used to care about this sort of thing and take it personally.
But it’s just not worth it. So I really don’t care.
I just want to be on the right side of the trend, make some money, and then go hang out with my family.
That’s my only goal here.
So a good way to be on the right side of the trend is to count how many stocks are going up vs how many are going down.
Again, we don’t want to arbitrarily subtract them from each other. We want to count one list, and then count the other.
Mathematically, the market cannot get worse without an expansion in the new lows list.
We don’t care at all about the new 52-week lows, and we likely won’t care for a while.
We need to see the 10-day lows list expand, then the 21-day lows list (1 month), then the 63-day lows list (3-months), then 126-day lows (6 months), and then finally after that we’ll take a look at the new 52-week lows.
Or maybe we see them all expand together. That’s possible too.
I really don’t care either way.
I just want to profit from it.
How about you?
What’s on your radar these days?
Feel free to chime in here.
JC
The post Where Are The New Lows? appeared first on All Star Charts.
Be the first to comment