

Data continues to be critical to the success of athletes, teams, and leagues alike. As a proud partner of Team USA, Tableau from Salesforce is working with individual U.S. Olympic and Paralympic athletes, including U.S. Olympian Ashton Eaton, to demystify their sport and performance data stories to create unique customer experiences—allowing fans to understand what it’s like to be on the track, court, or playing field.
The thing I like about decathlon is also the thing I dislike: It’s the maximum challenge, but also the maximum frustration.
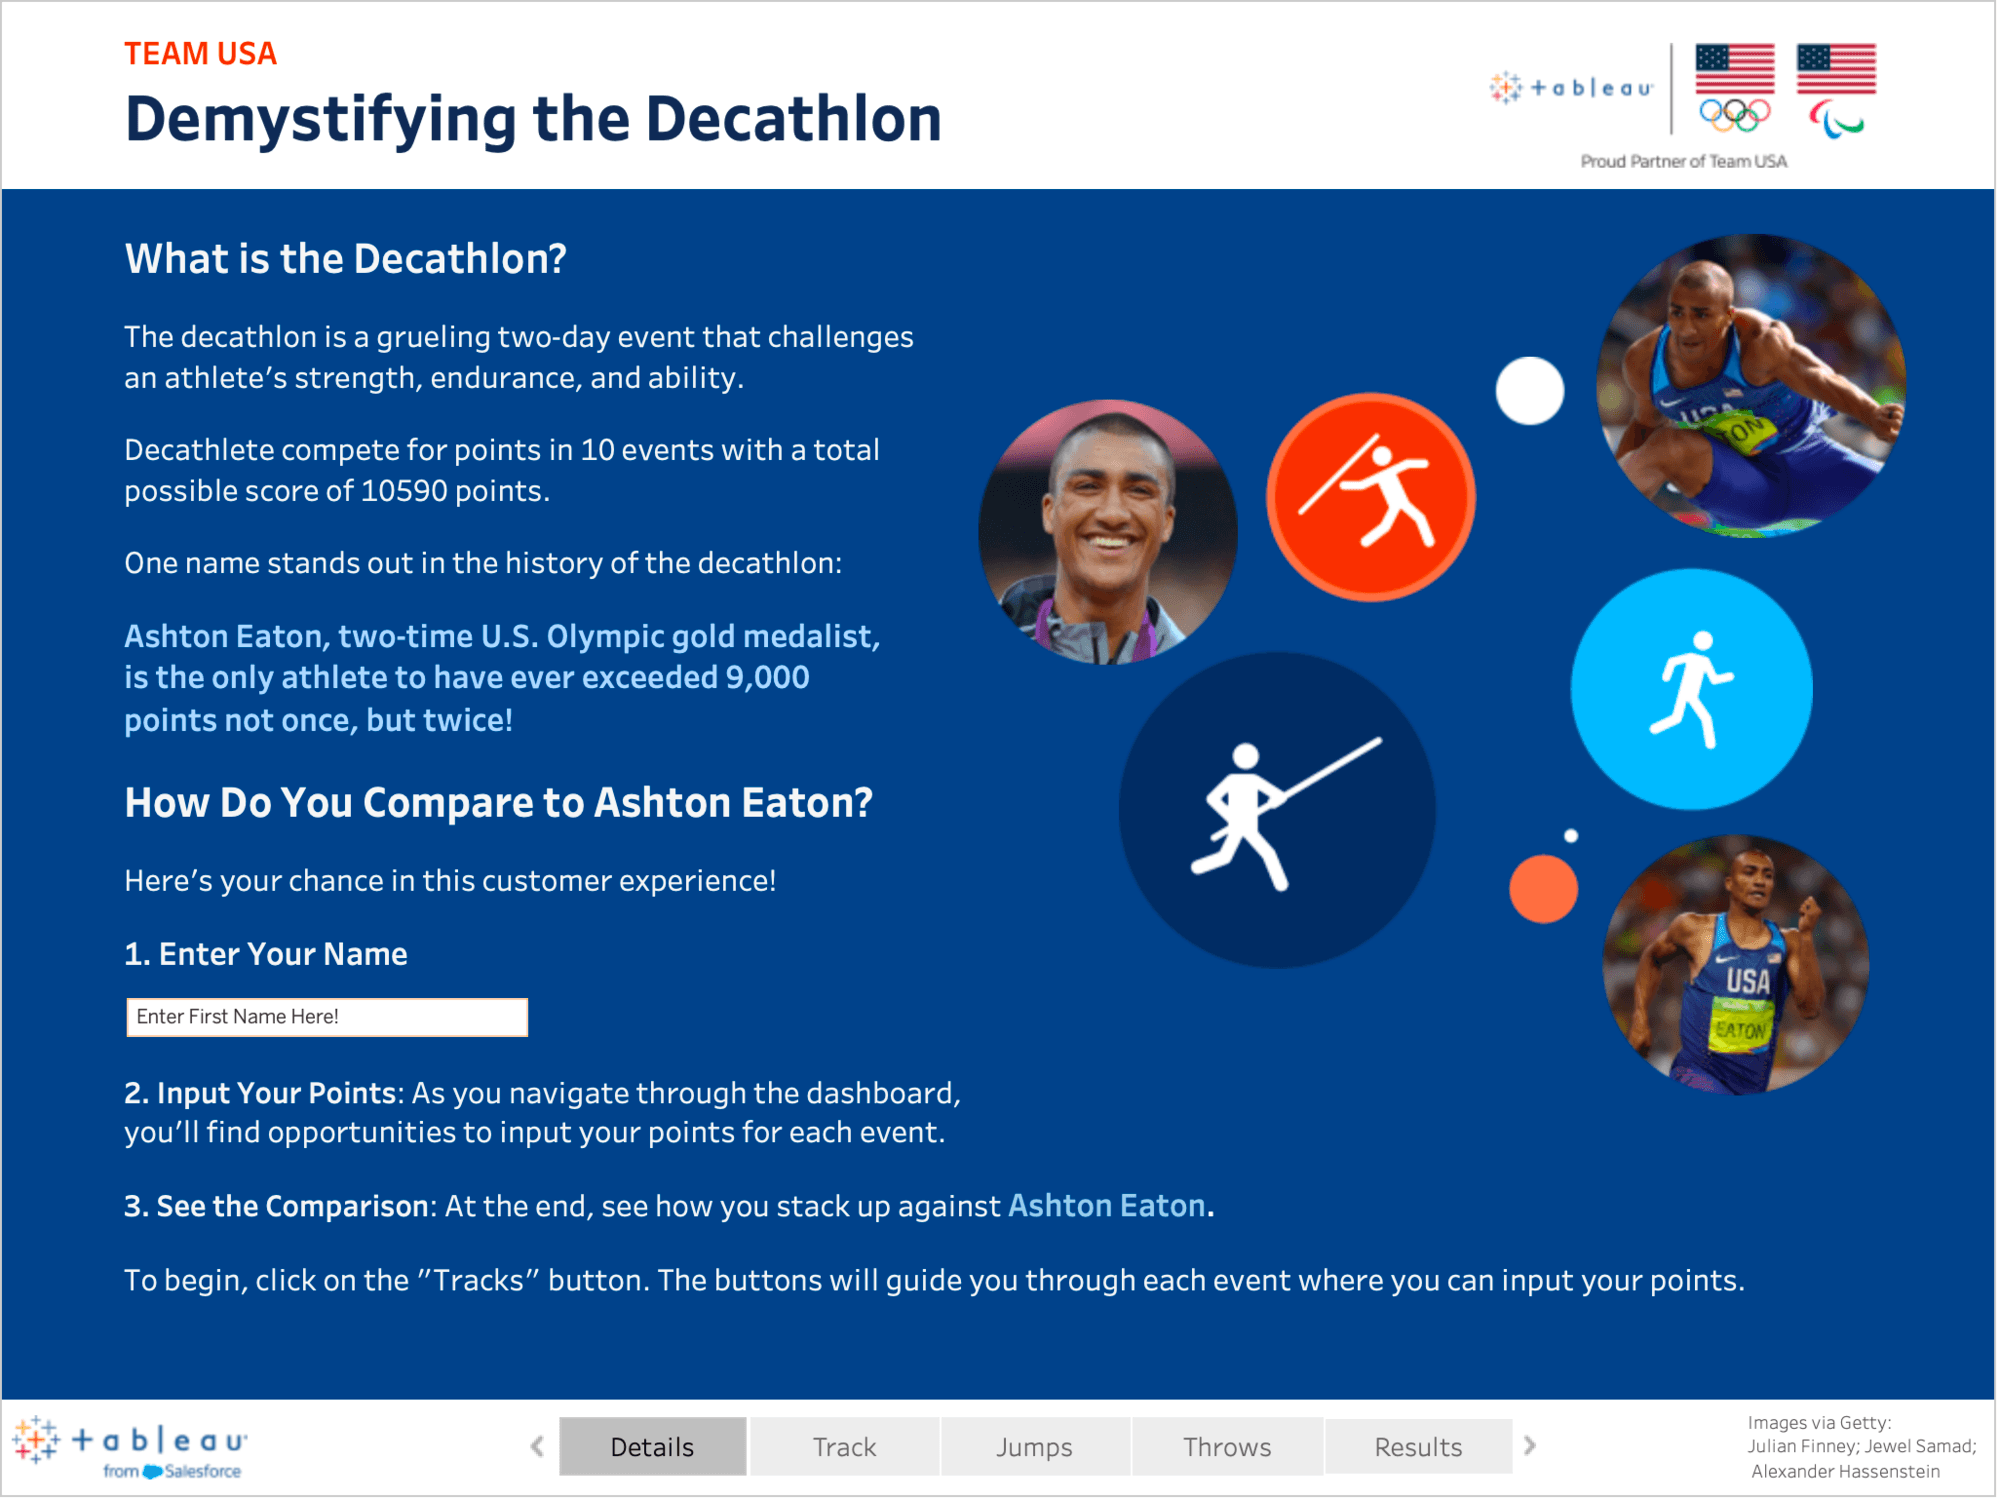
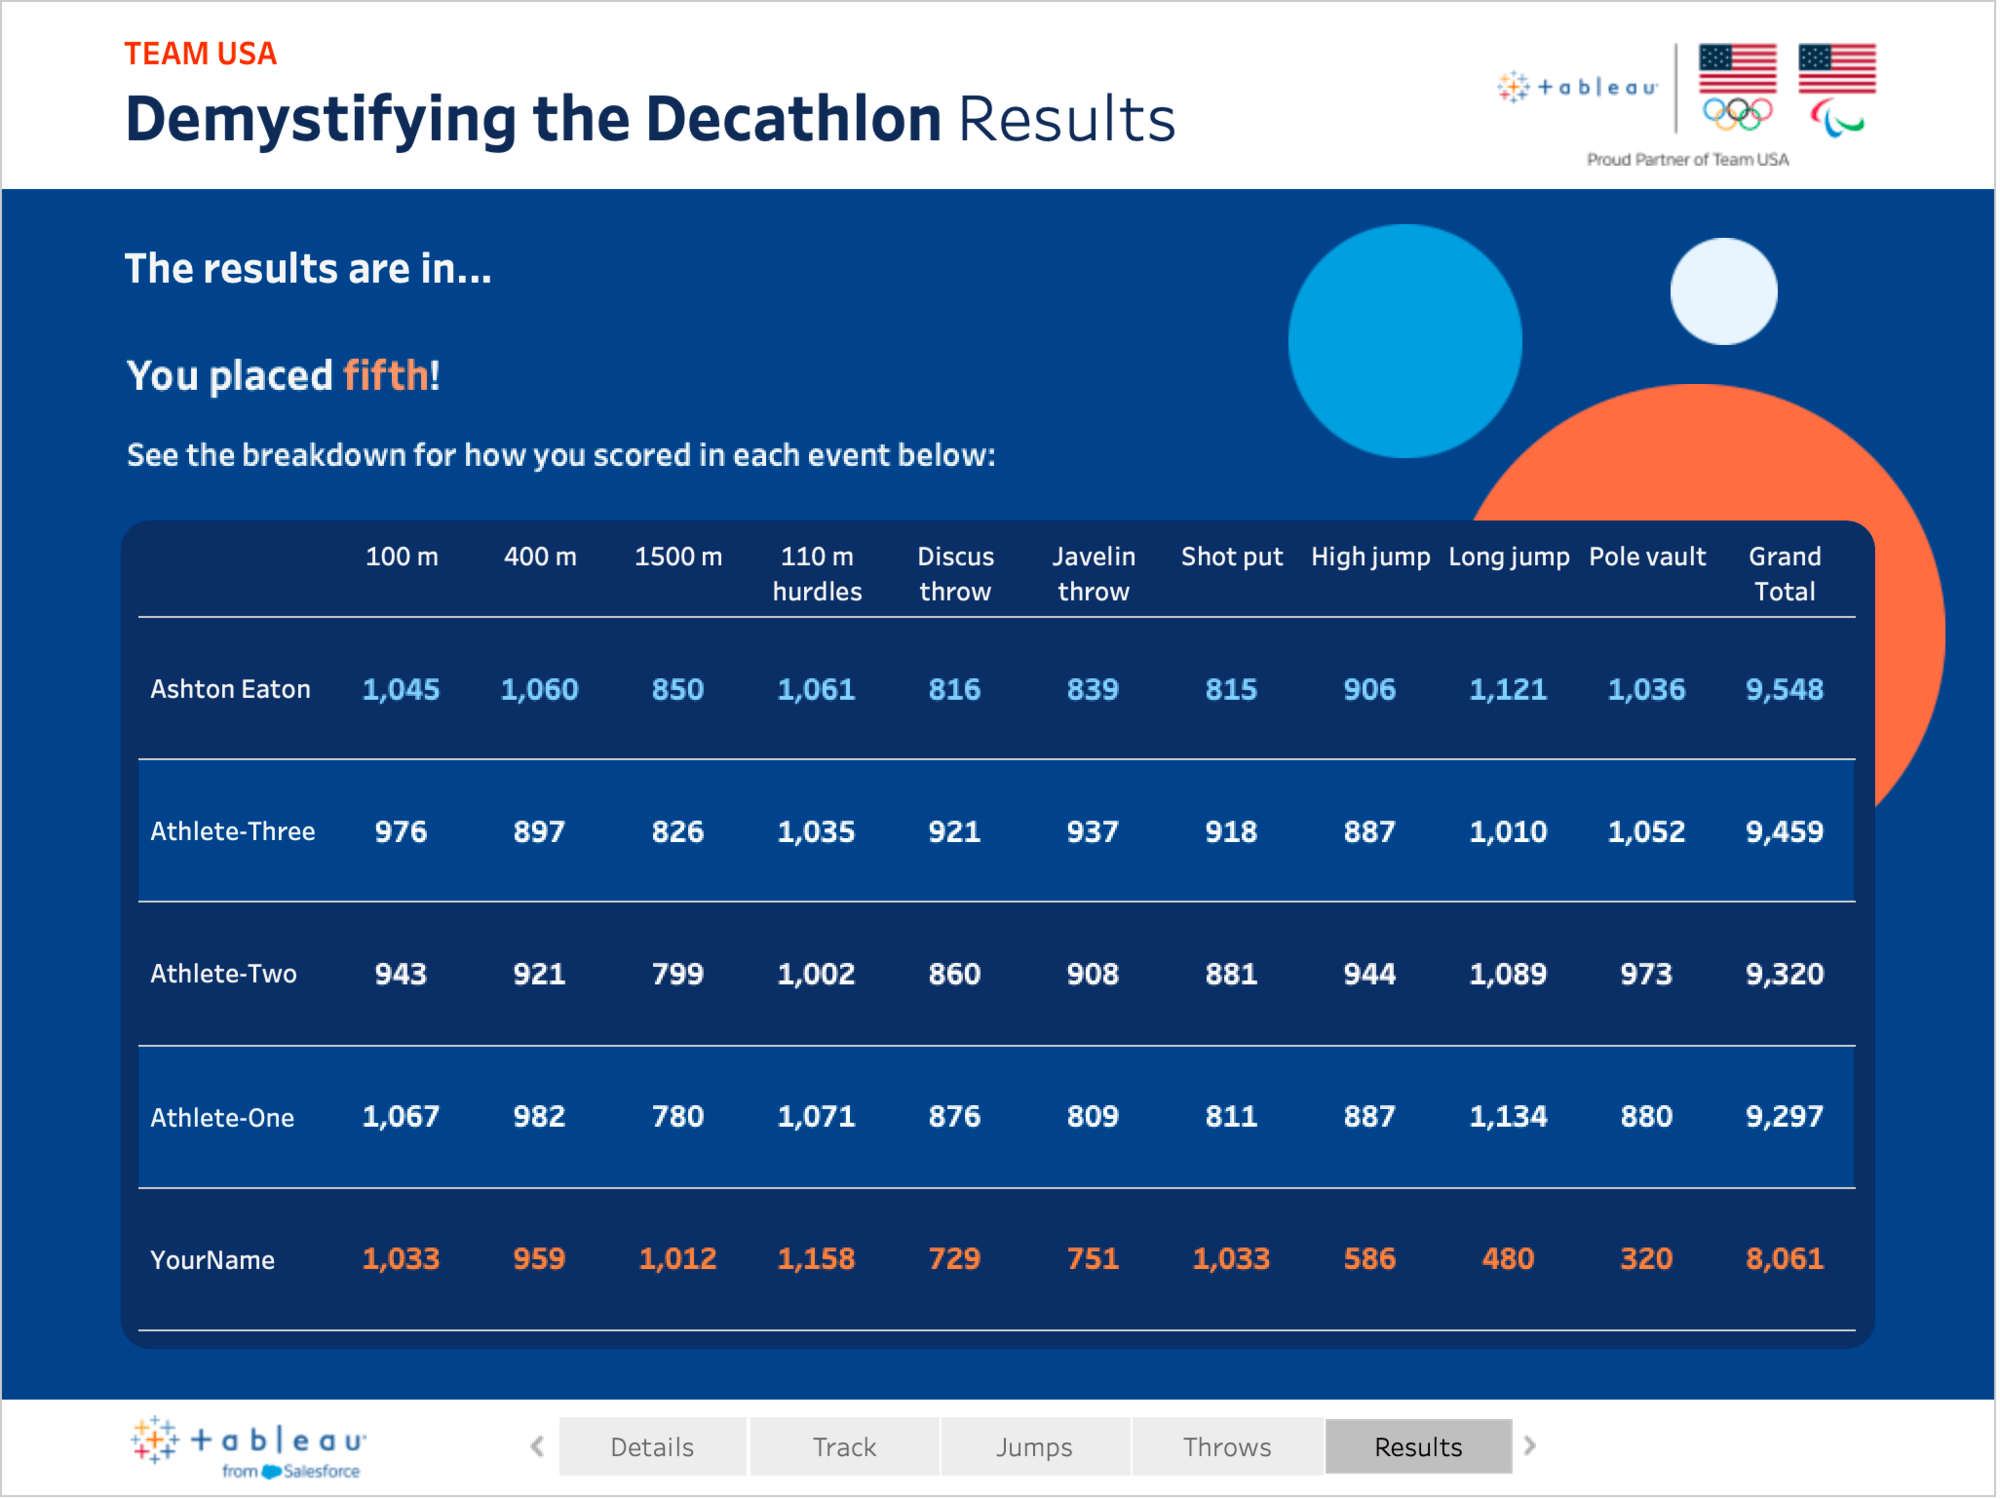
Ashton Eaton is a two-time U.S. gold medalist in the decathlon: a two-day contest that includes 10 events encompassing running, jumping, and throwing events. Eaton is the only athlete to ever surpass 9,000 points twice and is considered one of the greatest athletes of all time.
As we looked to bring Eaton’s story to life, it became clear that his unique approach to preparation for competition was the ideal story to activate as part of the Tableau space at Dreamforce 2023. So, how did we do it?
A compelling data story begins with discovery
Building context from a subject matter’s expertise.
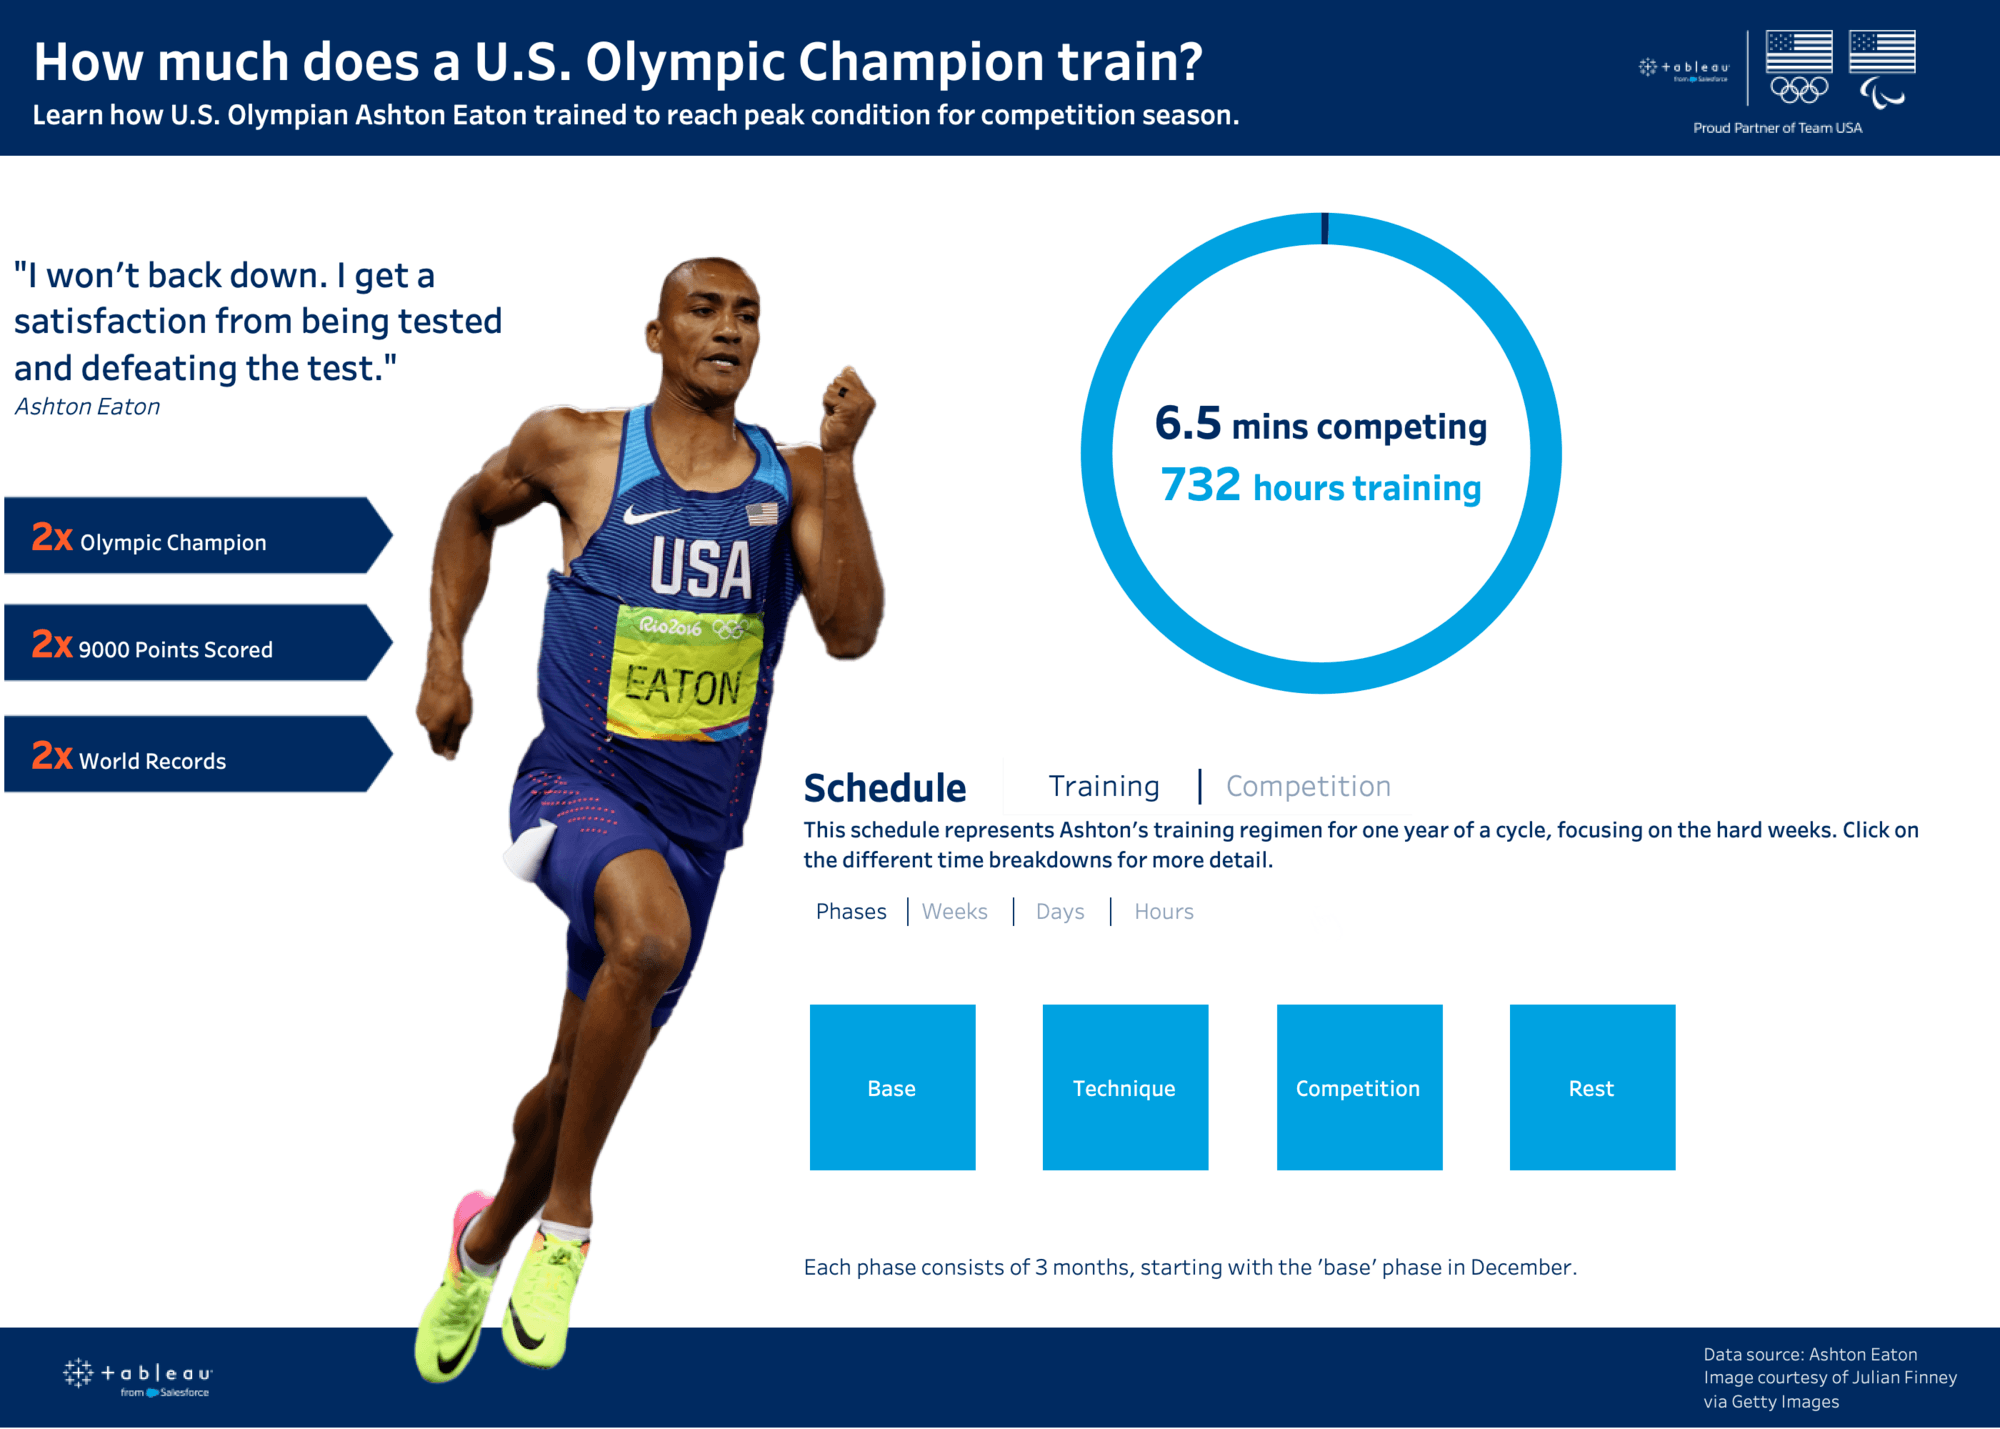
We were fortunate to speak with Eaton directly, hearing about how he developed his training plans and approach to competitions. In this one-hour discovery session, he described how the decathlon works and lessons learned throughout his career. This call provided us with the needed context to ask deeper questions, find interesting case studies, and hear his perspective. For example, many of us were surprised to learn that decathletes only compete for six minutes over two full days, but prepare years in advance for the 10 events.
After the call, we compiled next steps on the workstream, including:
- Building a dataset and visualization of Eaton’s career decathlon scores and training regimen
- Developing clarifying questions and following up
- Driving internal alignment on strategy
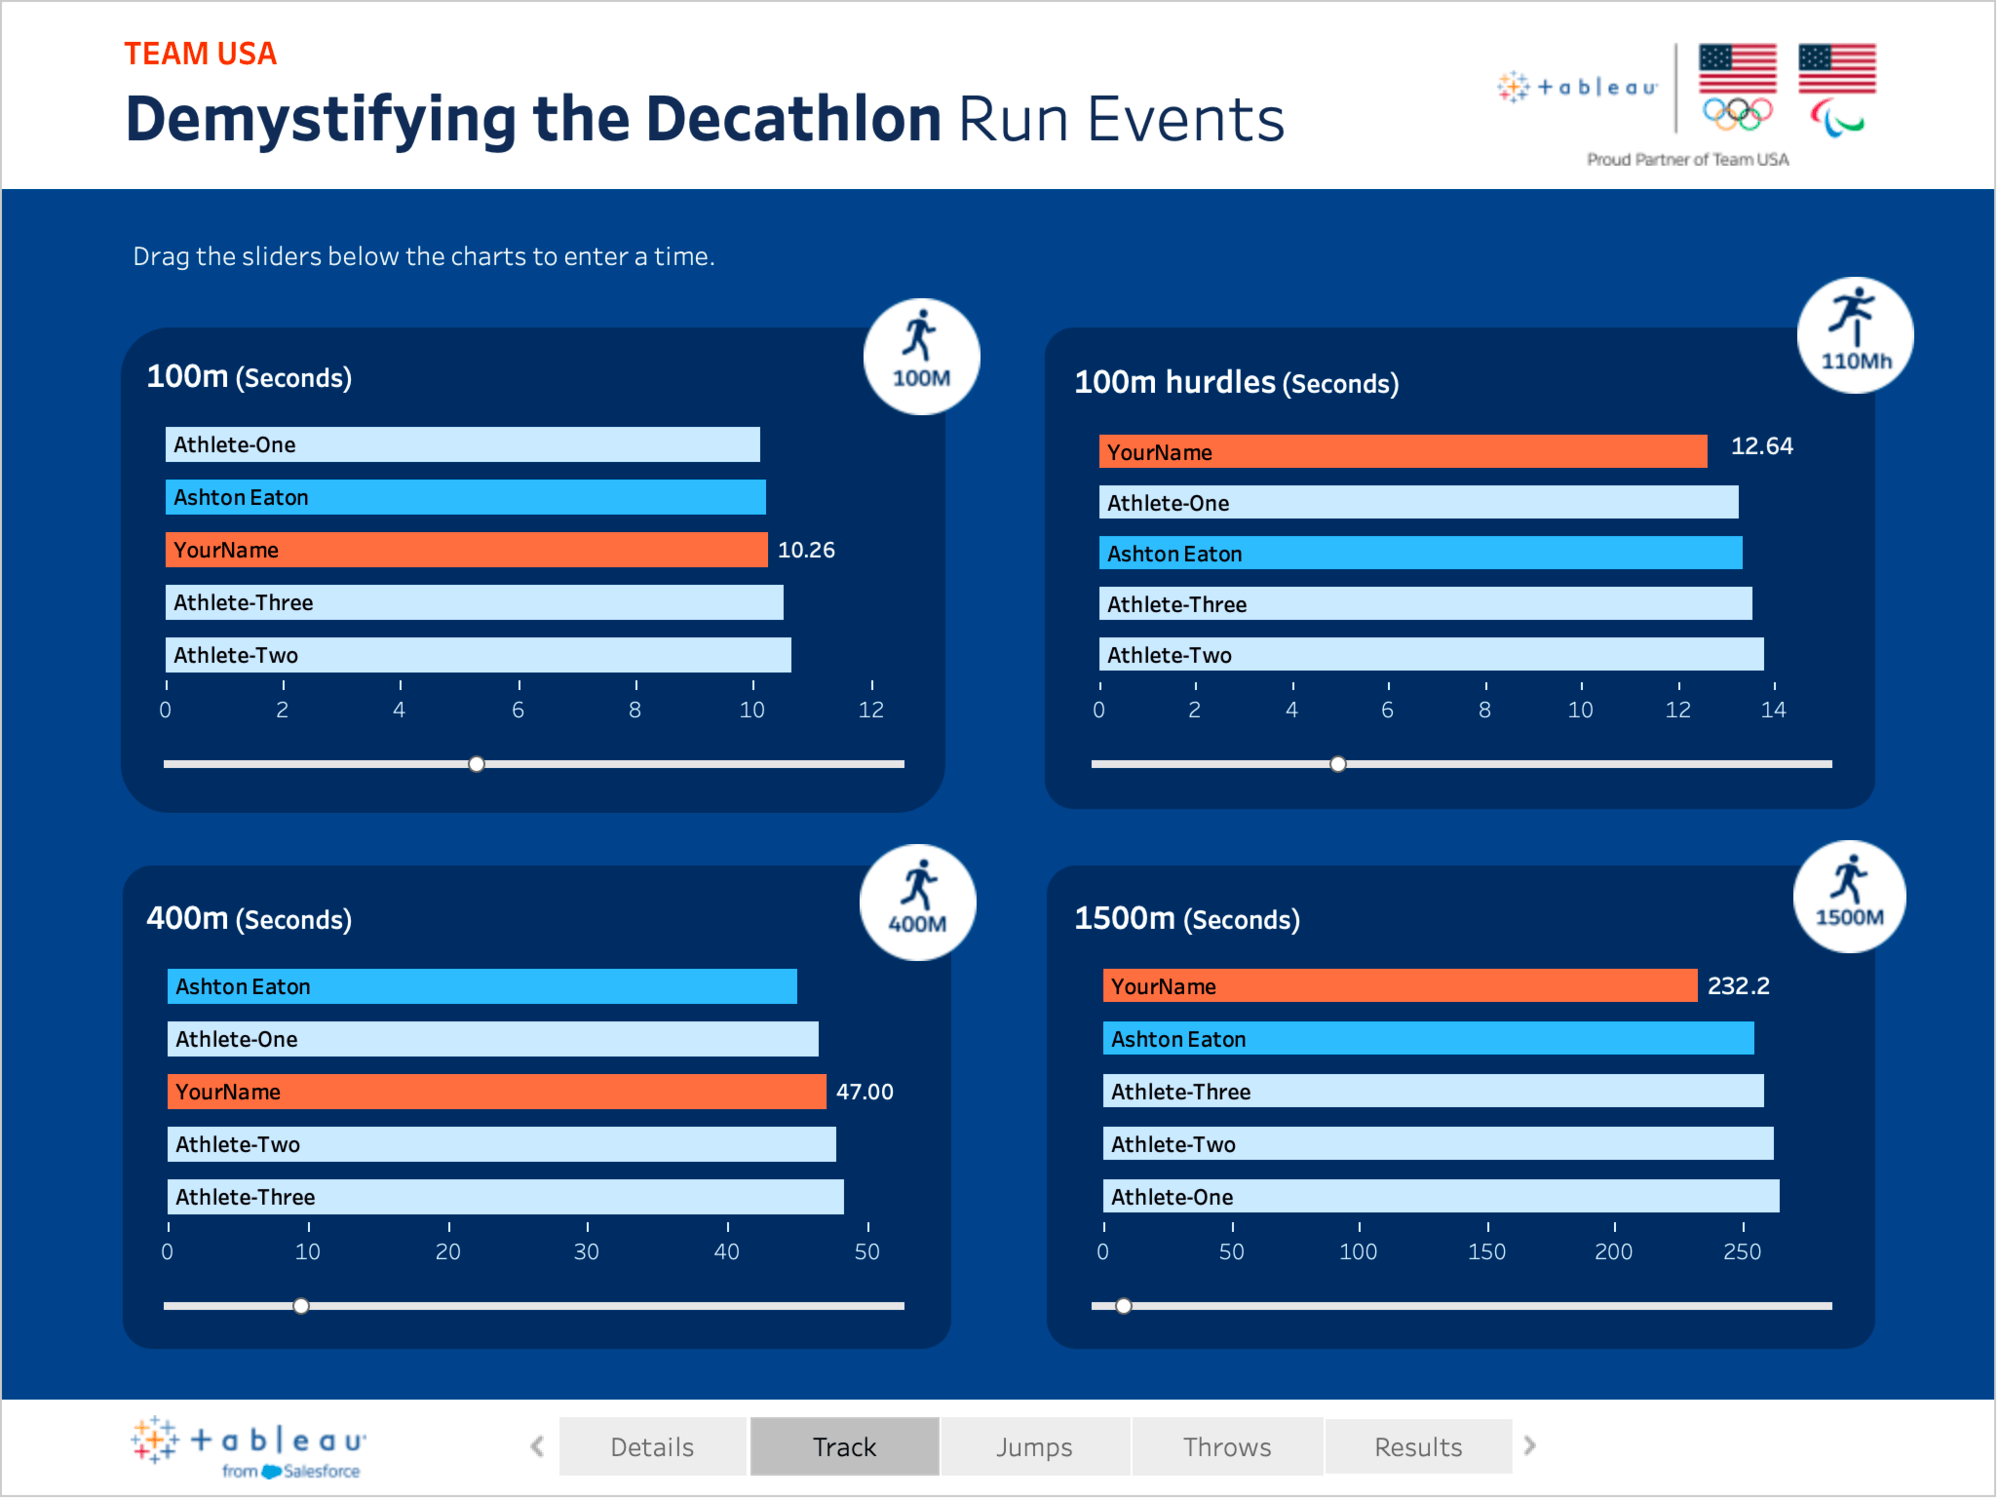
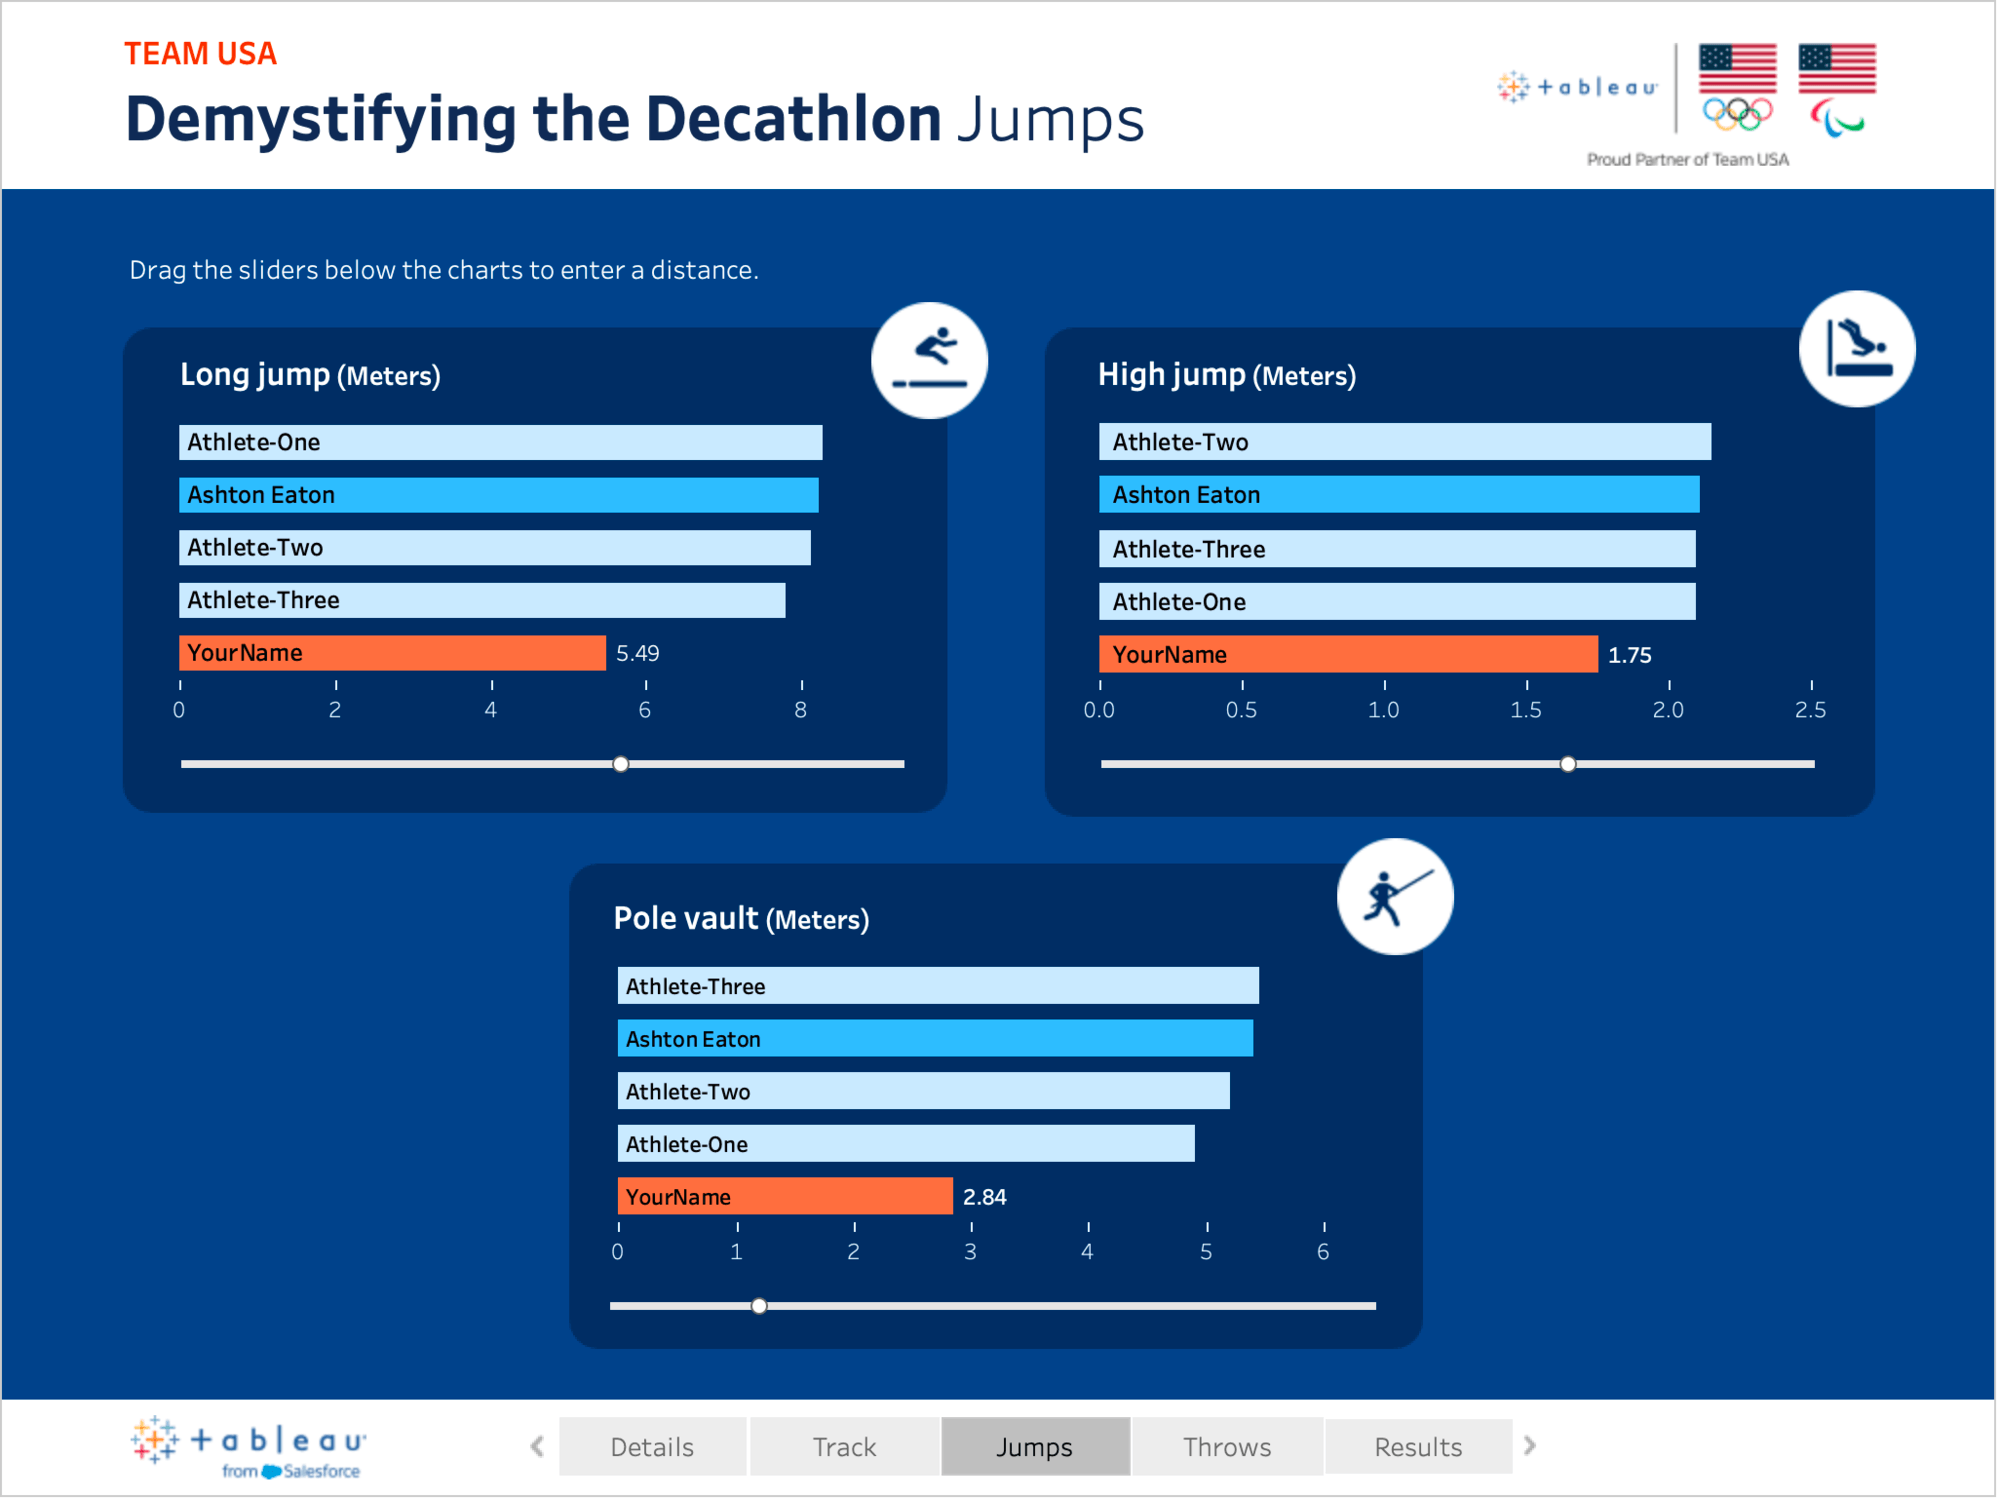
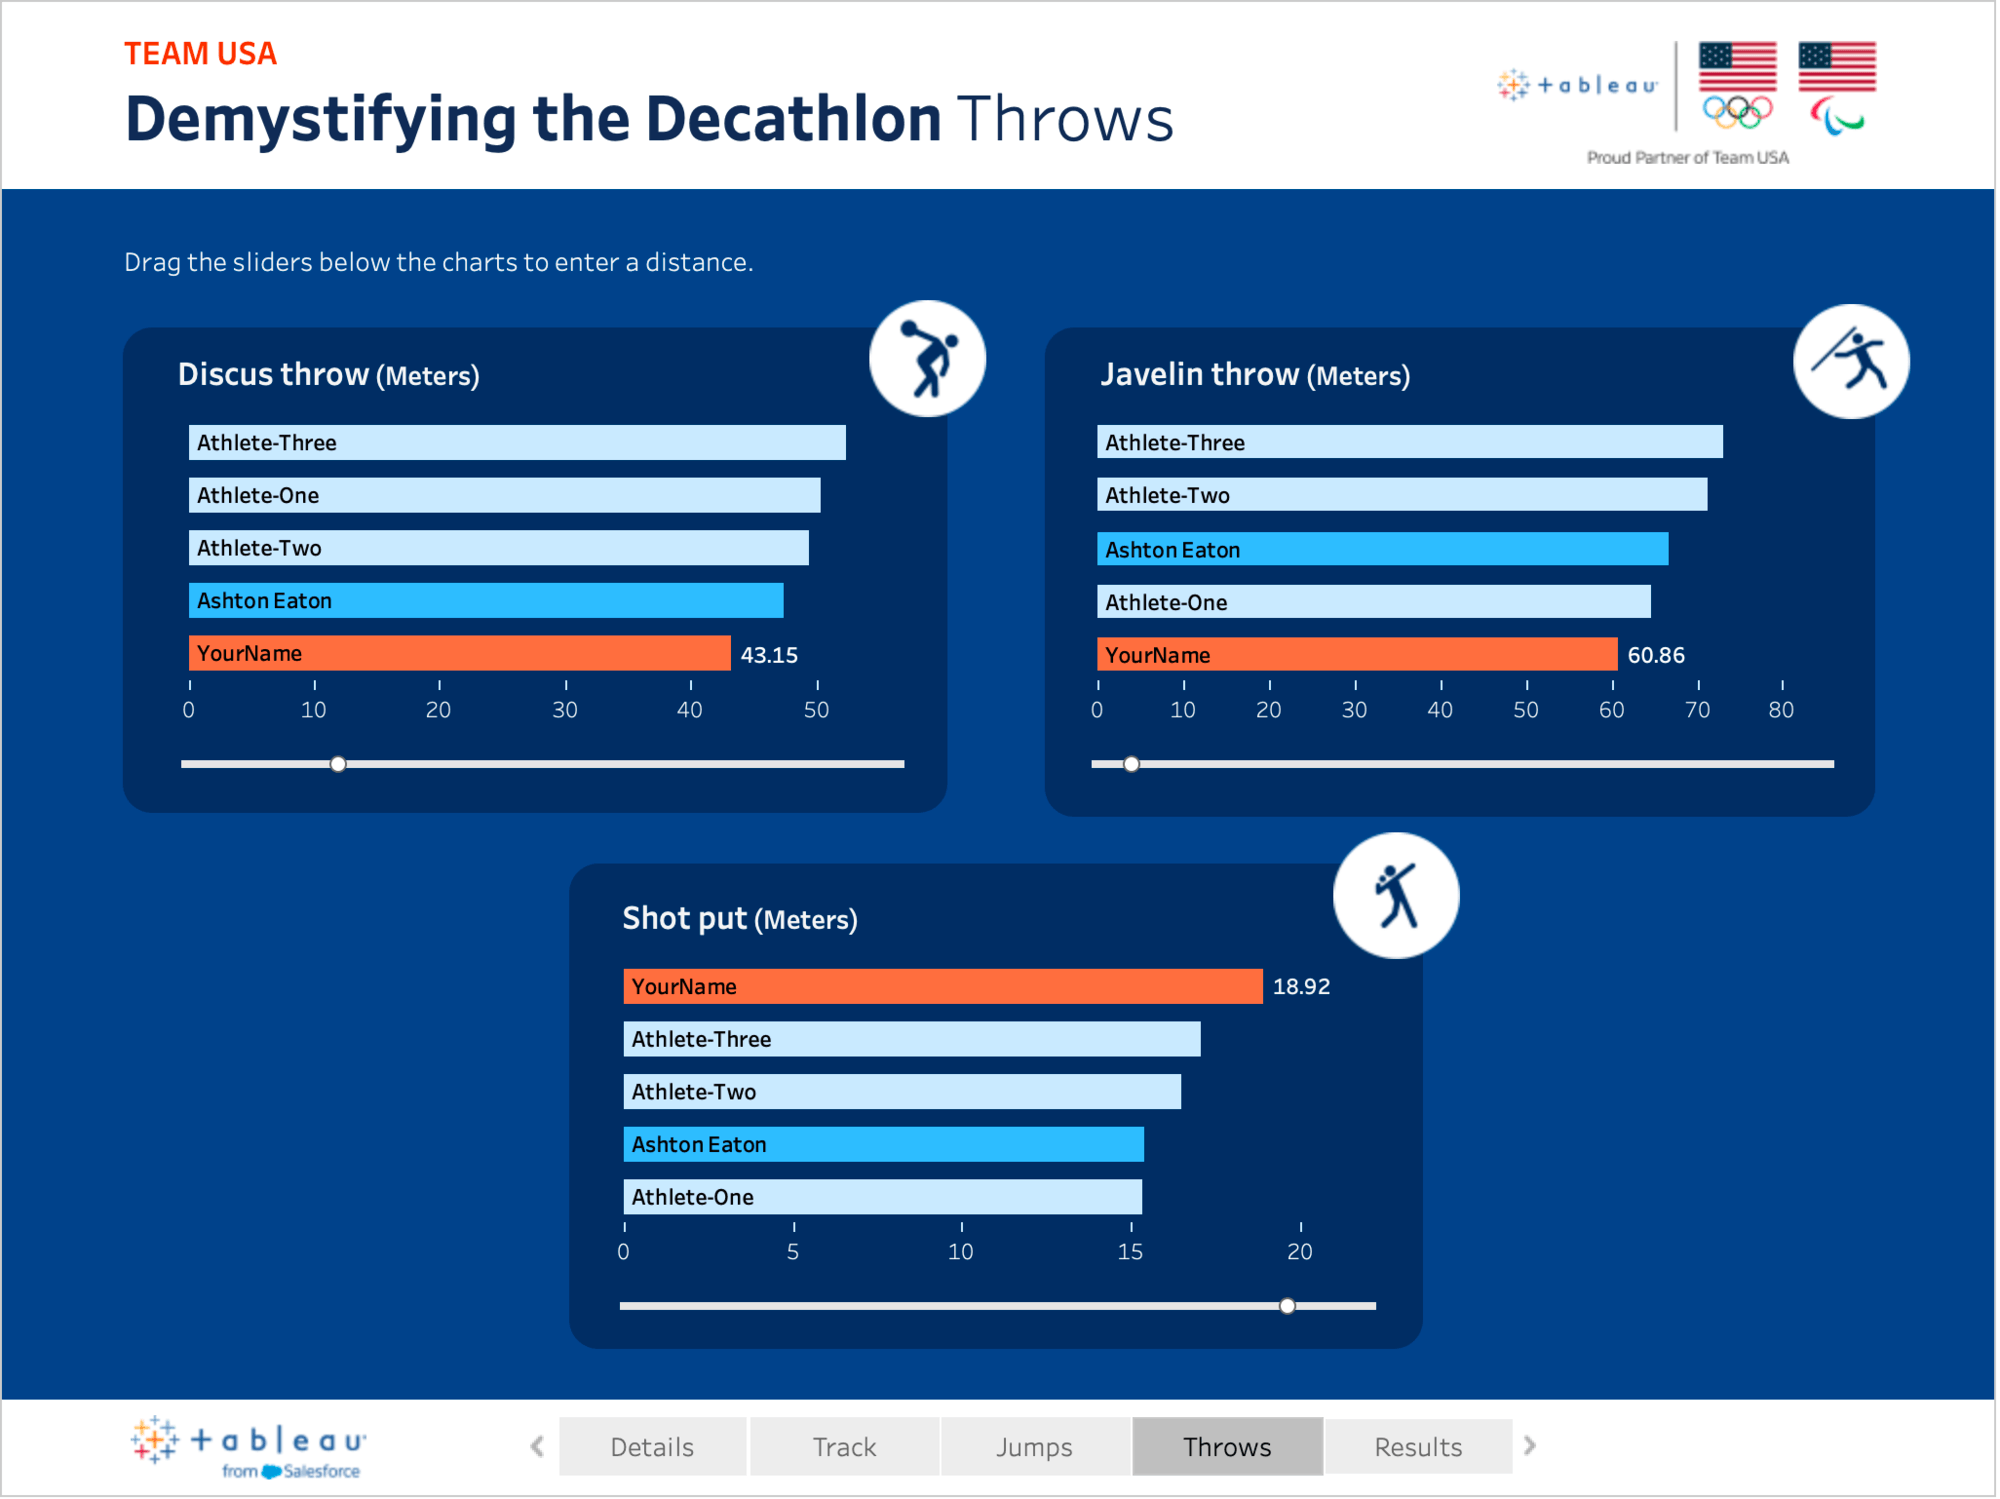
This discovery process was key to understanding the most important aspects of the decathlon (and visualizing them with Tableau), including the ratio of throw to run/jump events (3:7), how to scale this experience for a mass audience, and finding the best way forward to bring this to life.
Creating an interactive story with data
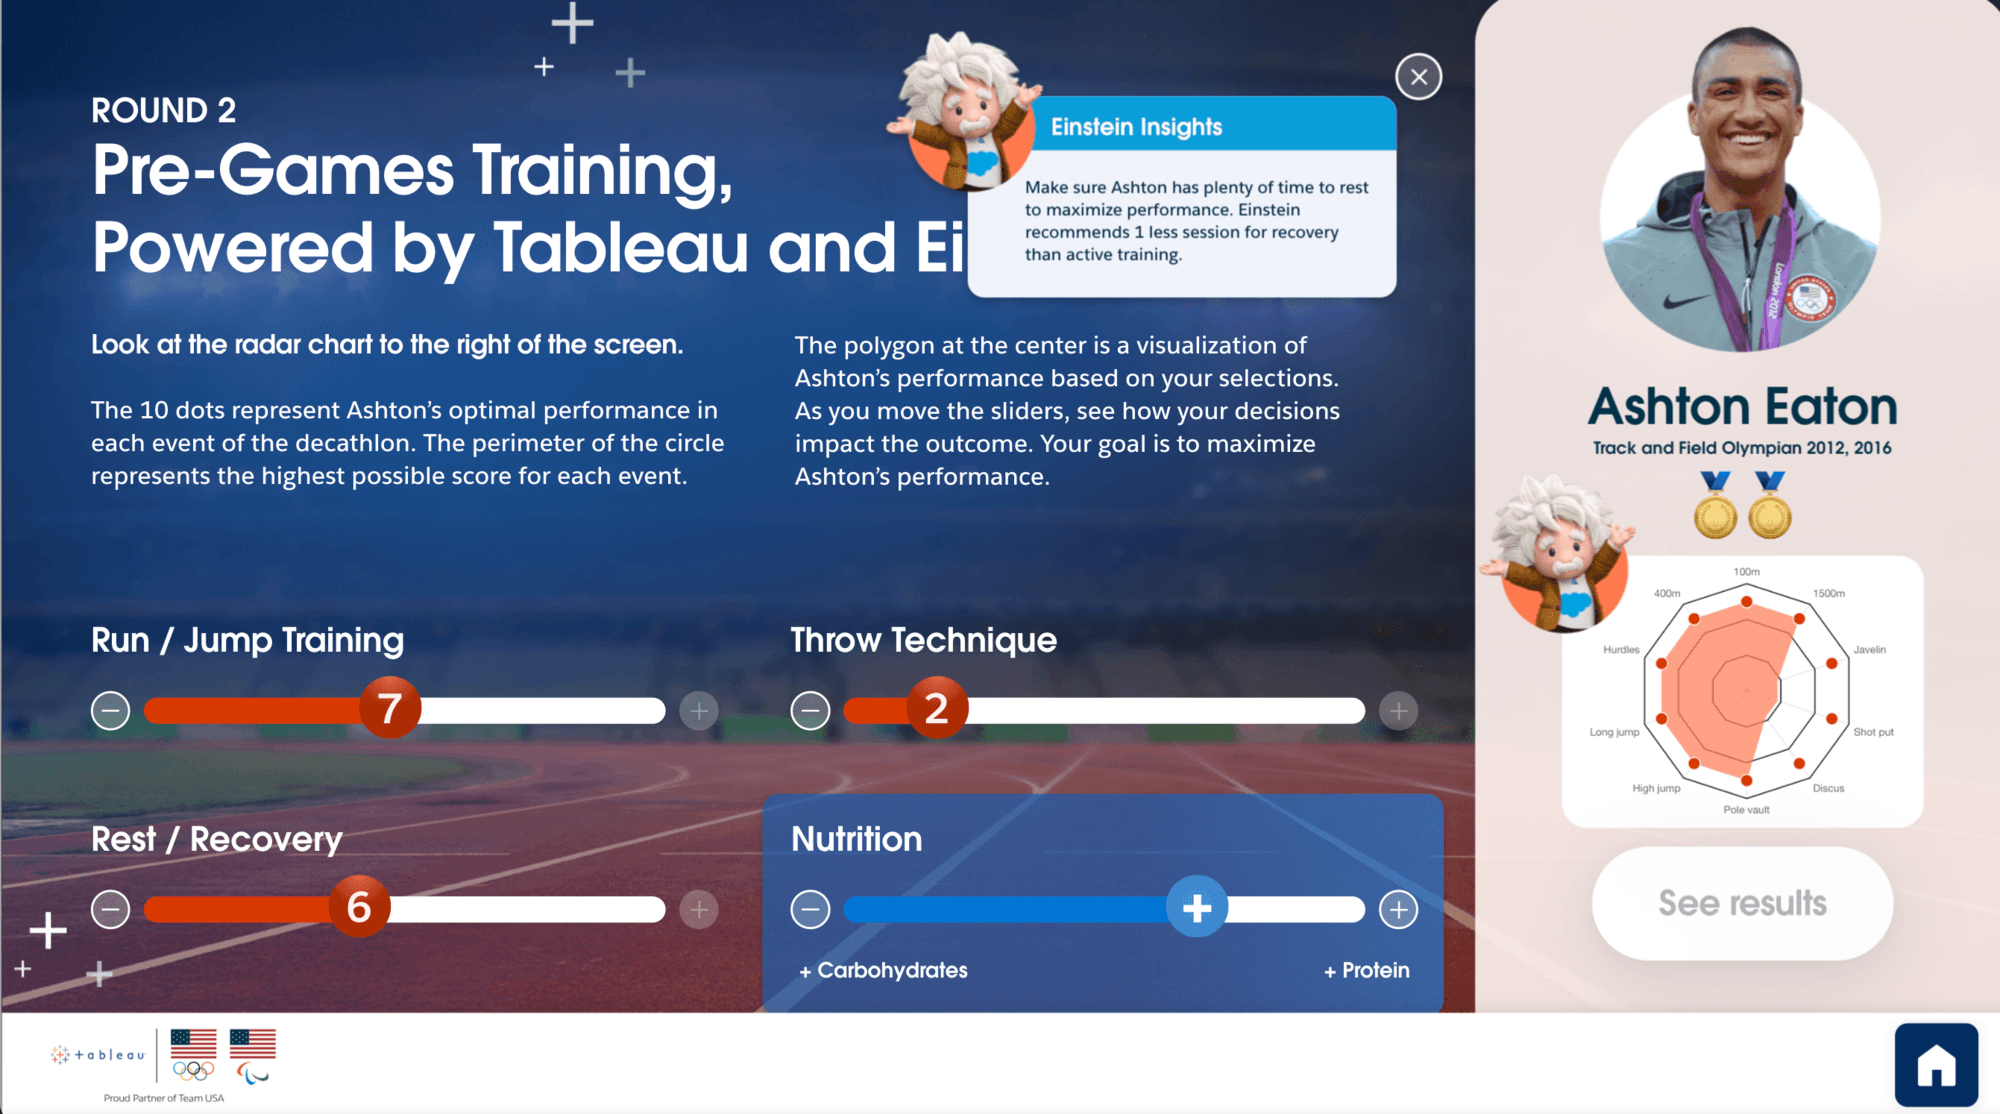
As we drafted a strategy for the activation, it became clear that Eaton’s training experience would make for a compelling data story to bring to attendees at Dreamforce. We also made the activation interactive. Customers would have the opportunity to make training choices using their gut instinct and then see their improvement in performance when using compiled data via Tableau and insights from Einstein.
Each customer’s training improvements would be visually represented through a sculpture at the center of the experience consisting of 10 transparent tubes, one for each decathlon event. Air in these tubes would blow balls upwards and downwards, with the height of the balls representing the participant’s “score”—the higher the better.
By leveraging Eaton’s training regimen, we created a sliding scale to allot time and energy across specific training sessions: running/jumping, throw technique, and rest. Based on his feedback, we developed a formula for the optimal allotments across the sessions. We also included nutrition as a key component to winning “gold” in the event, showcasing the importance of Eaton’s focus on proteins as competition approached. Finally, we visualized the concepts using a radar chart, where attendees could see the impact of their sliding scale decisions in real time.
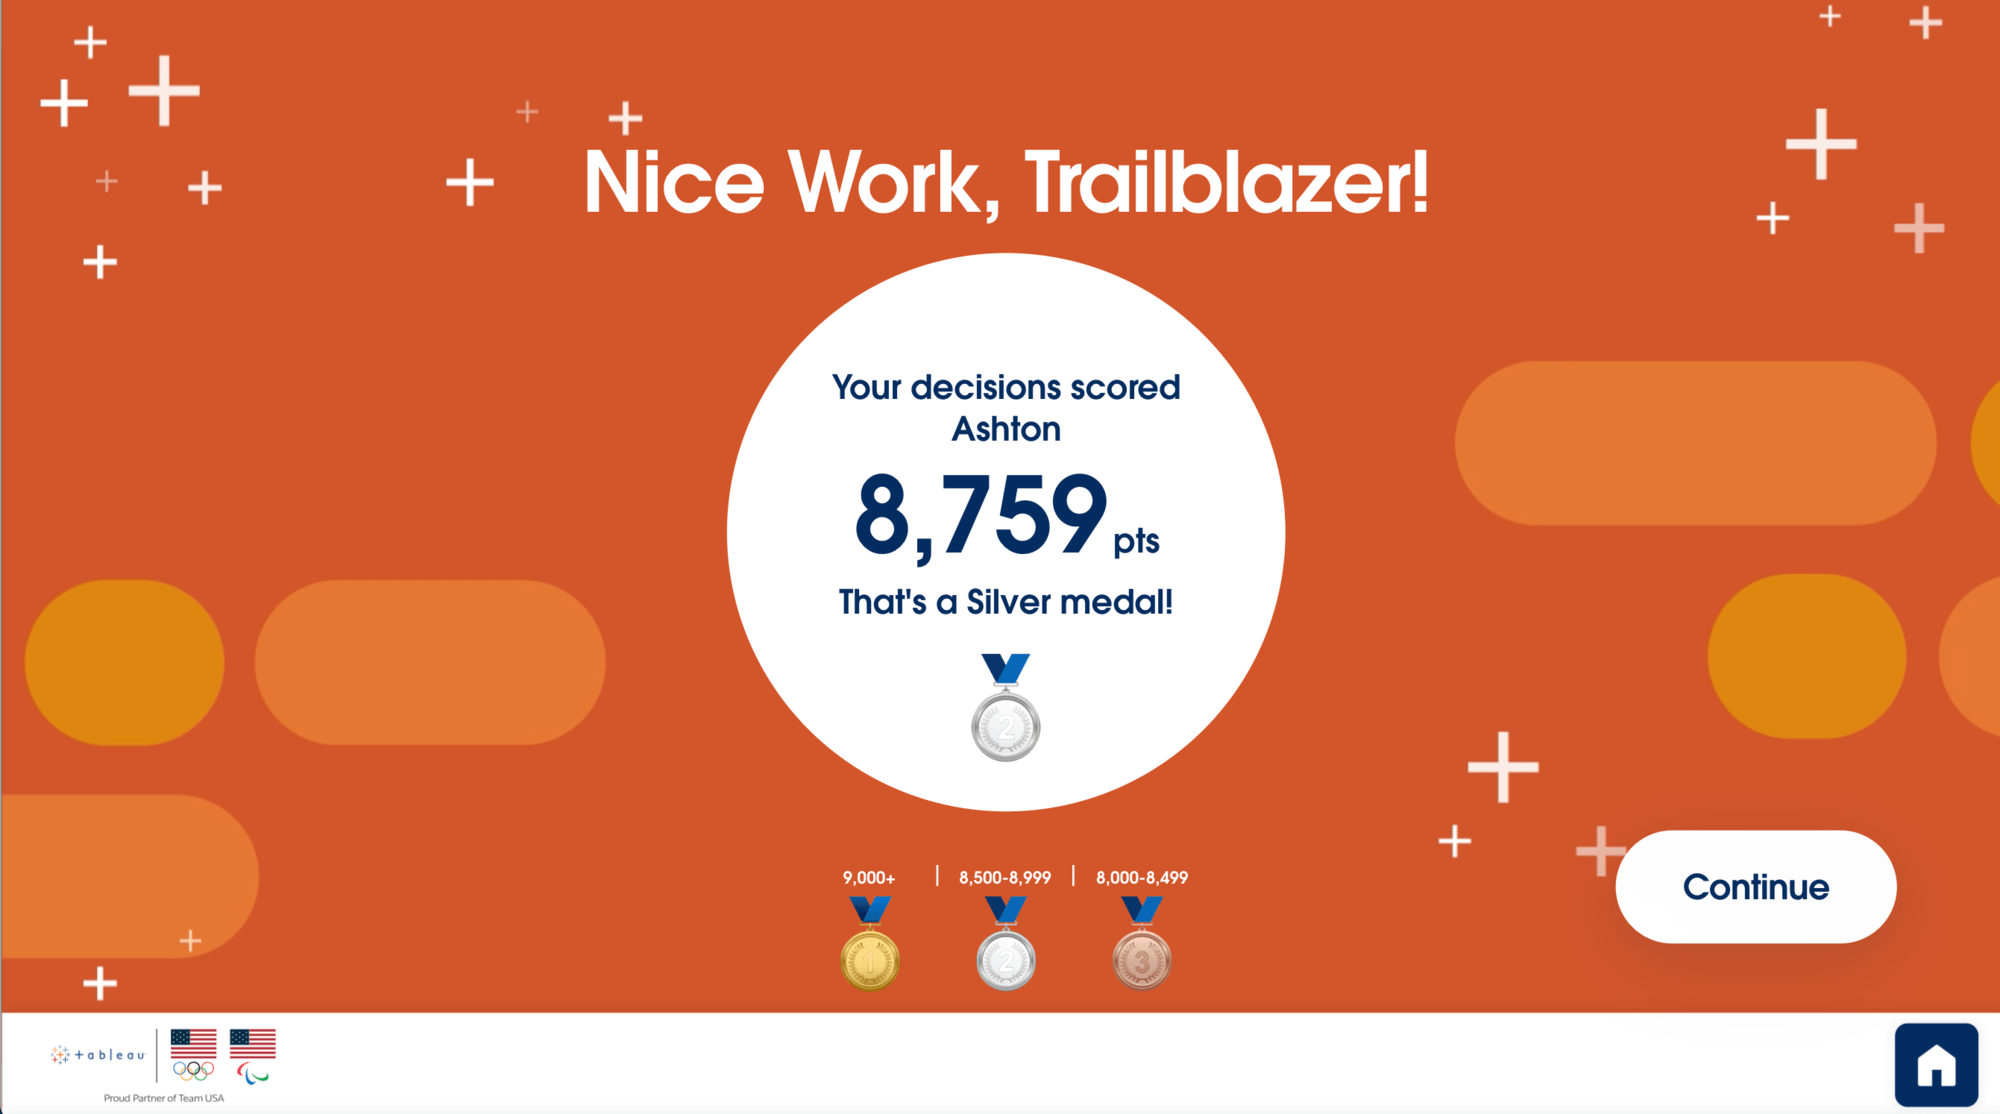
We then revisited the competition data collected in our discovery phase to identify the ranges for winning “gold” in the activation. This helped make the activation as realistic as possible, showcasing how difficult it really is to succeed in this two-day gauntlet of events.
Using Tableau to tell immersive data stories
Our team leveraged Eaton’s experience and career to bring an immersive activation to a strategic event, allowing customers to experience firsthand how data can help everyone, including U.S. Olympians and Paralympians, make informed decisions.
The lessons learned can extend well beyond this onsite experience and can be applied to any team or organization interested in using the power of data. Each step in the process of bringing Eaton’s training regimen to Dreamforce required leveraging subject matter experts, developing context, and making analytics digestible for a wider audience. These are the same lessons customers can follow every day to tell data stories using Tableau and improve data-driven decision-making.
Learn more about Tableau and Salesforce’s partnership with Team USA, and how your organization can achieve more with a data-first mindset.
Visualizations by Salesforce Florian Ramseger; Tableau Visionary Irene Diomi, and Harry Beardon, Linda Duong from The Information Lab.
Be the first to comment