

From the Desk of Alfonso Depablos @Alfcharts
As we exit the best three-month period for the stock market, we’re looking to our risk appetite indicators to help us determine the next directional move.
The charts below are all excellent tools for helping identify what kind of environment we are in.
During bull markets, investors embrace risk. In bear markets, they reduce their risk.
Understanding and analyzing the balance between defensive and offensive assets helps keep us on the right side of the trend.
Let’s get into it:
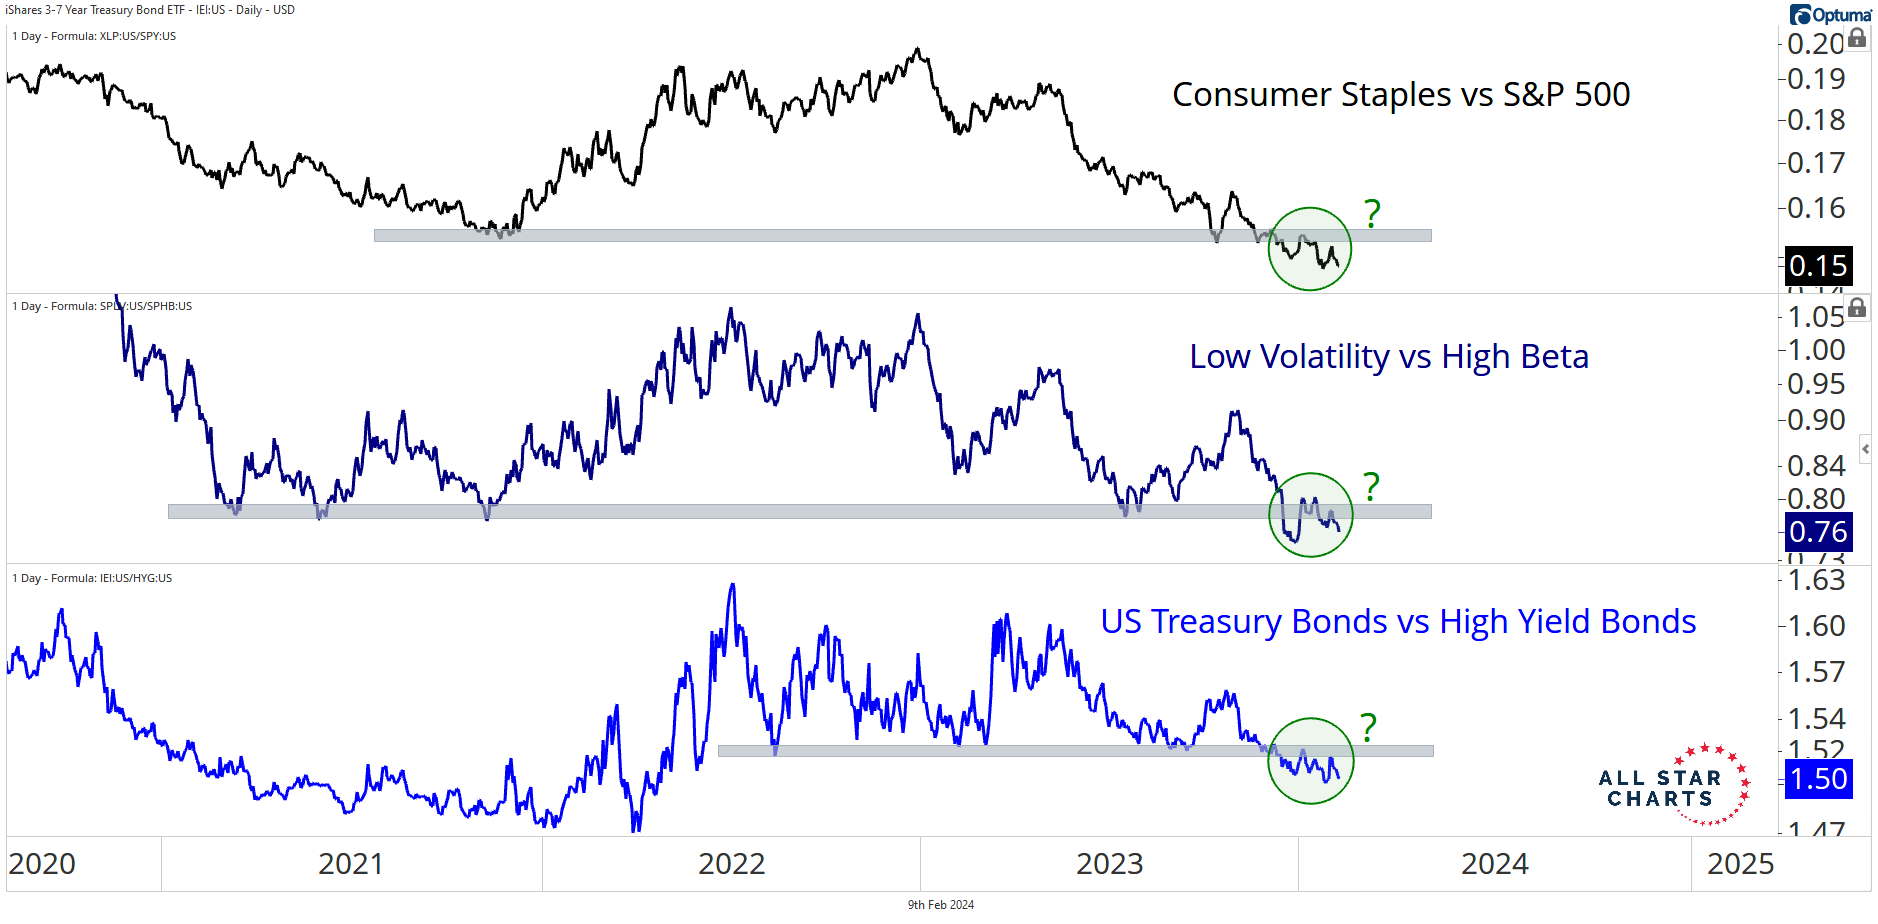
Each ratio shown above is a different representation of defense versus offense.
If Consumer Staples reclaim the late 2021 lows relative to the S&P 500, that’s likely coming in an environment where stocks are having a hard time.
The same is true about the defensive nature of low-volatility stocks. While it is common for these stocks to outperform their high-beta counterparts during bear markets… If we see this defensive leadership over any material timeframe during a bull market, it would be a real cause for concern.
Carrying the same logic over to bonds, US Treasuries catching a sustained bid relative to high yield, indicates derisking among investors and potential stress in credit markets.
These are characteristics of bear markets, not bulls.
So, what are these charts telling us right now?
While we saw a brief spurt of defensive rotation and these ratios all rebounded recently, it is nothing to write home about… The primary trends remain firmly lower, and the moves appear to be fizzling out just as quickly as they began.
Takeaway: If these ratios print failed breakdowns at these key levels, it will be a big warning of elevated downside risk for equities.
But don’t worry bulls, it hasn’t happened yet.
As always, we love to hear from you, so shoot us a note and let us know what you think.
Alfonso
Be the first to comment