

Welcome back to this week’s edition of the Power BI blog series.
This week, we continue looking at Field Parameters with an example using
multiple Field Parameters.
Until recently, allowing users to dynamically change the dimensions
and scales on charts in Power BI reports required some serious DAX knowledge. However, since the arrival of
Field Parameters, there is a function specifically designed for this purpose. Users can dynamically adjust the measures or columns
being analysed in a report by using Field Parameters. Even better, Field Parameters are easy to set
up. We just choose the measures or columns
the readers would want to change, and this feature can assist report readers to
explore and personalise the report output.
In Part
1, we created our first Field Parameter:
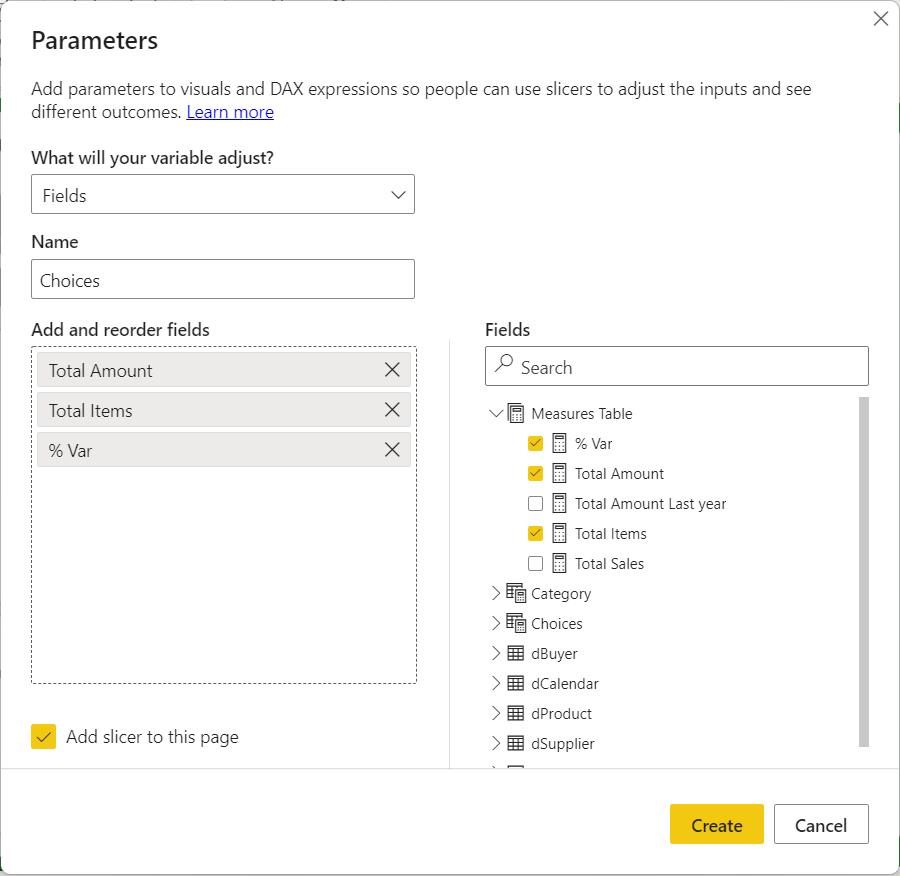
Since the ‘Add slicer to this page’ option was selected, we created
a slicer on the page as soon as we clicked on the Create button.
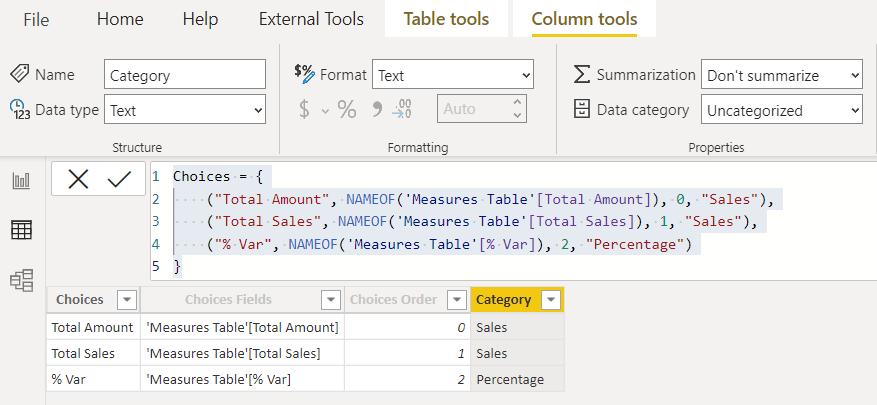
In Part 2, we looked at the DAX syntax
of the Field Parameter and how to edit it.
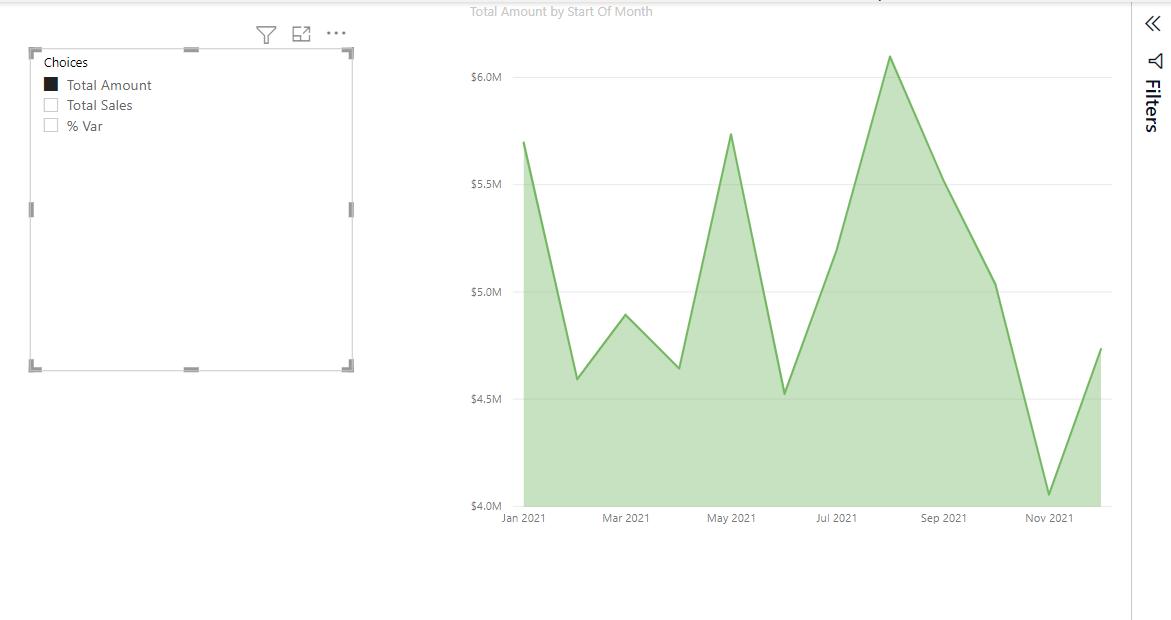
Last time, we looked at an example where an Area chart used
the Field Parameter in the Y-axis.
This week, we create another Field Parameter to use on a
chart, using the same process as Part 1. This time, the
Field Parameter includes fields from multiple tables:
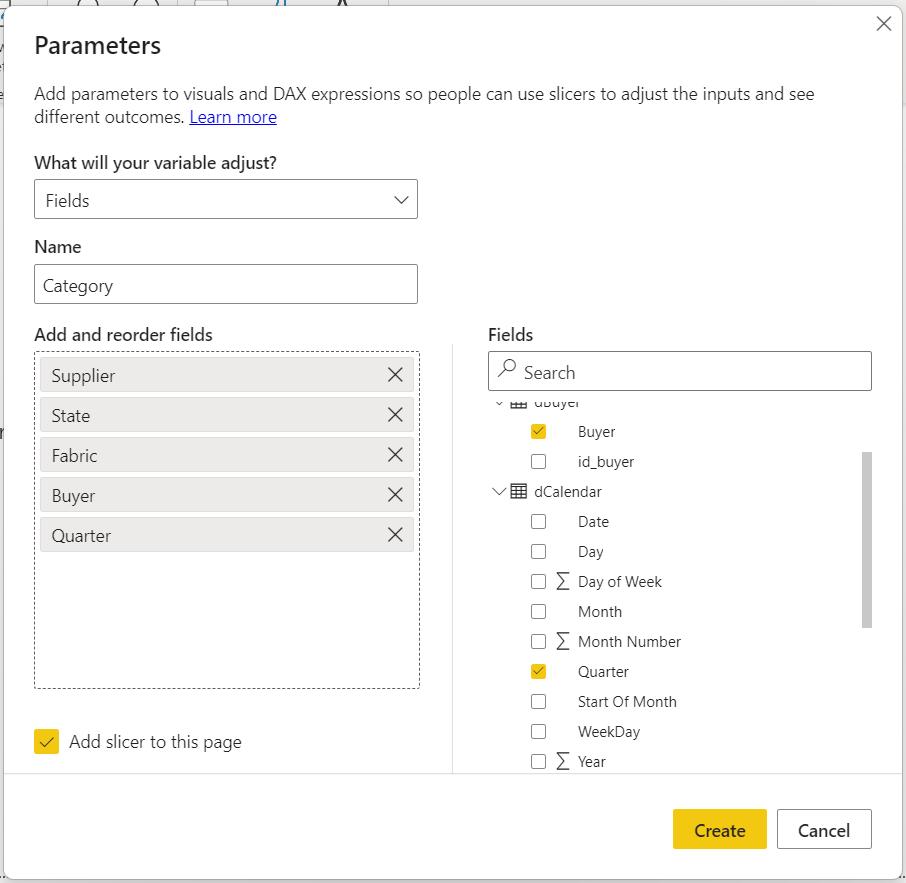
We have
- Supplier and State from dSupplier
- Fabric from dProduct
- Buyer from dBuyer
- Quarter from dCalendar.
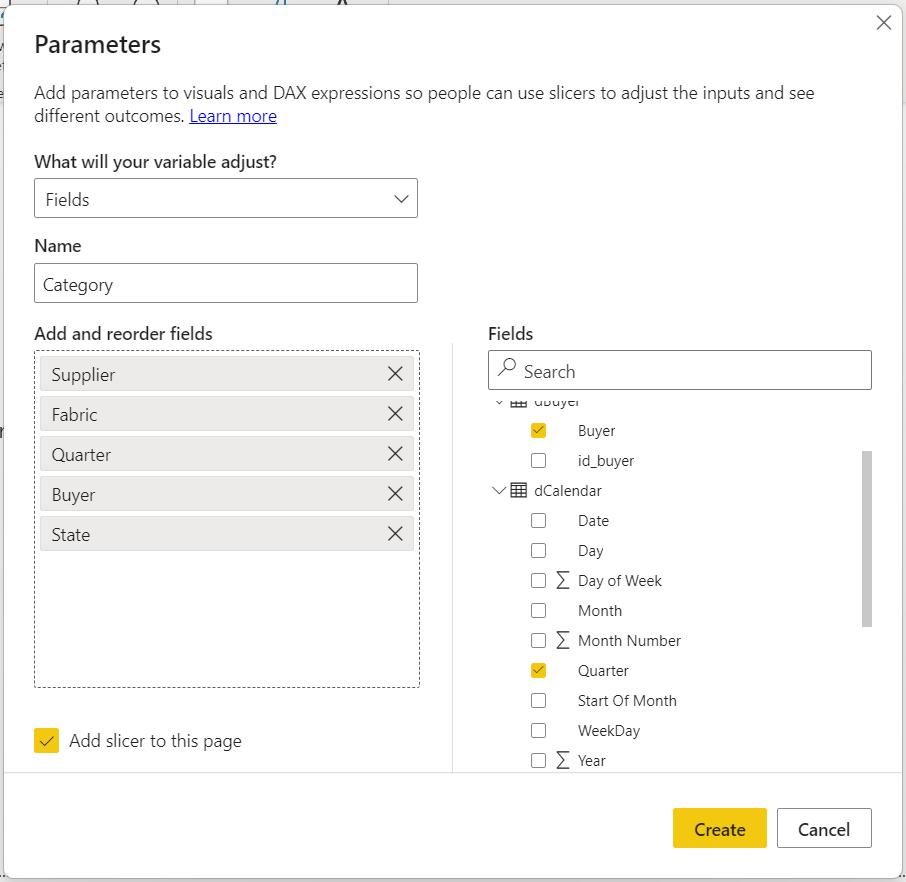
We change the order by clicking and dragging in the ‘Add and
reorder fields’ section:
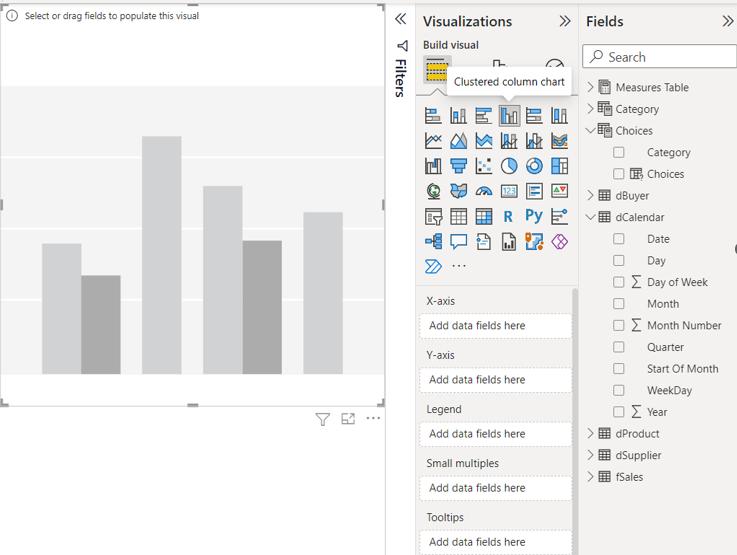
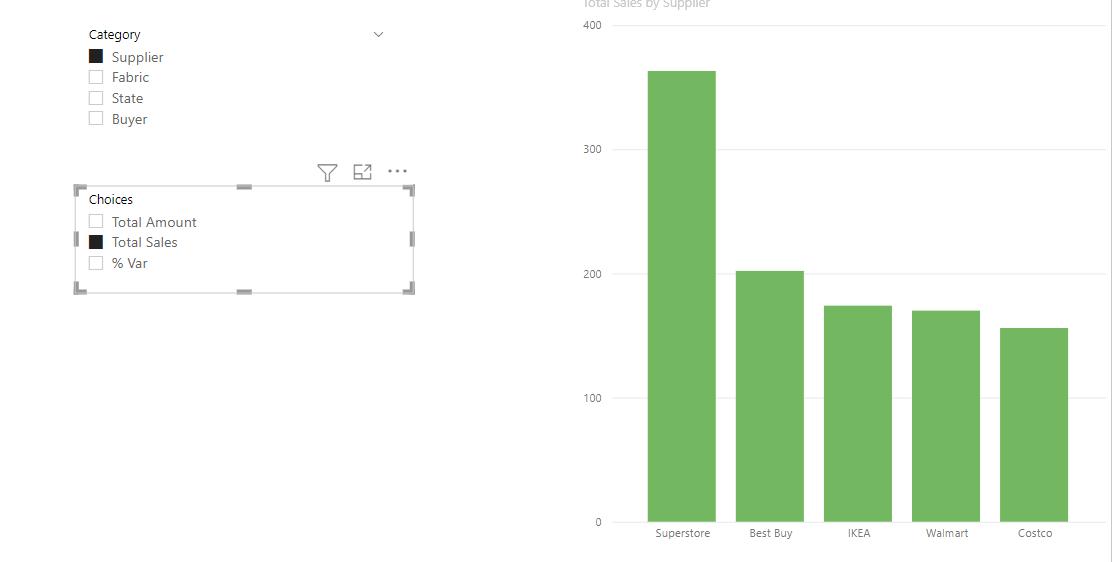
This time, we opt to create a Clustered column chart:
We drag Category to the X-axis, and Choices to
the Y-axis.
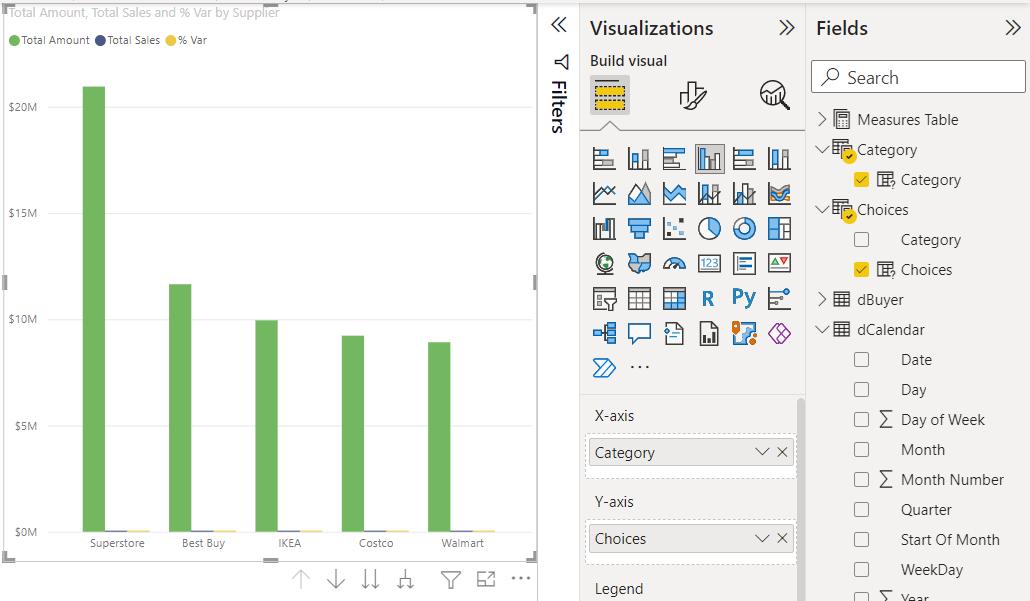
We add slicers for both Field Parameters, which allows us to
dynamically examine the data on the Clustered column chart from different
perspectives:
Check back next week for more Power BI tips and tricks!
Be the first to comment