

From the desk of Steve Strazza @Sstrazza
Monday night we held our September Monthly Conference Call, which Premium Members can access and rewatch here.
In this post, we’ll do our best to summarize it by highlighting five of the most important charts and/or themes we covered, along with commentary on each.
Let’s get right into it!
1. Semis Hit Resistance
The stock market has been in a correction phase for two months as major U.S. indexes ran into resistance and rolled over this summer.
When we dive beneath the surface, we see similar behavior at the industry level, even for the strongest groups.
The chart below shows the Semiconductors ETF $SMH failing at an overhead supply zone marked by the old all-time highs.
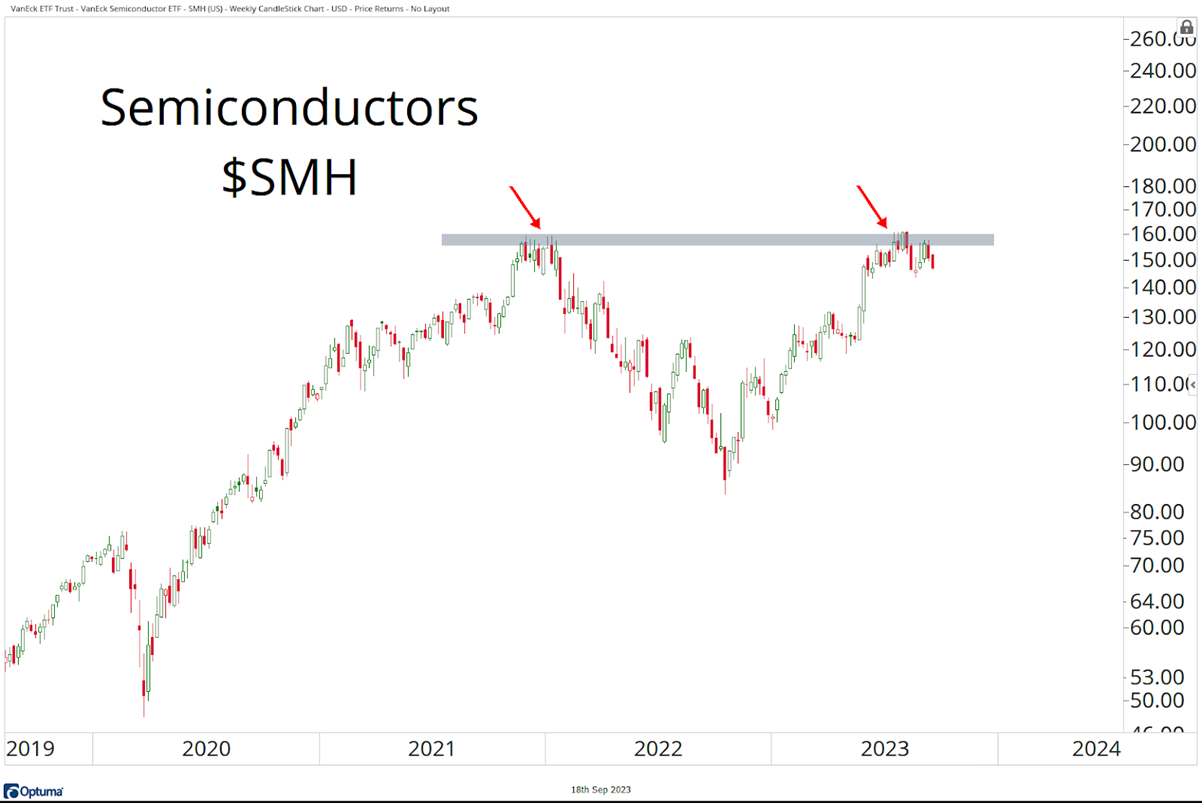
This tells us buyers need more time to digest gains and build up the fuel that is necessary to reclaim this critical level.
Until semiconductors and other leadership groups can achieve valid breakouts, the path forward is likely to include more corrective action.
However, if and when the market is ready for its next leg higher, we expect semiconductors to be one of the first groups back at new highs.
2. Energy Powers On
Commodities are back in the driver’s seat as participation expands beyond the leading agricultural contracts.
When it comes to energy contracts, crude oil futures have been on a tear, gaining over 30% since late June.
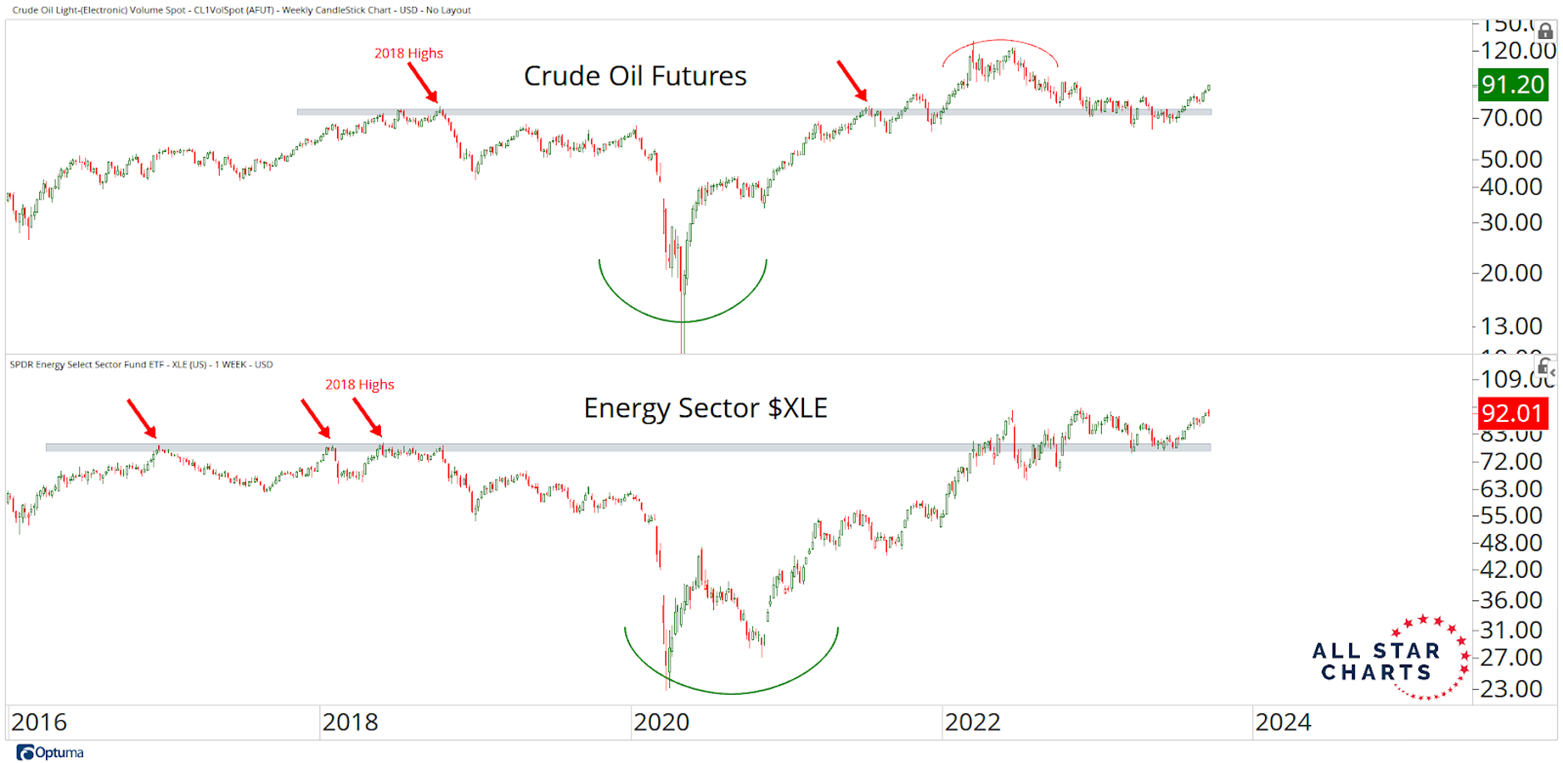
The same is true for the Energy Sector $XLE which has been leading the way higher in the back half of the year. In fact, it’s the only sector to book positive gains since the major averages peaked this summer.
After holding above a shelf of former highs from 2018, XLE reversed to the upside and is currently testing resistance at the highs from last year.
With crude looking poised to head back into the 100s, we think it’s only a matter of time until XLE breaks out of its current range.
Not only would this reaffirm our long-term bullish thesis for oil & gas, it would also indicate the commodities supercycle remains intact.
3. Growth at a Crossroads
Not only are tech and growth stocks running into overhead supply on absolute terms, but the relative trends imply that their outperformance is due for a breather.
Below is the Nasdaq 100 pressing against a critical resistance level relative to the Russell 3000:
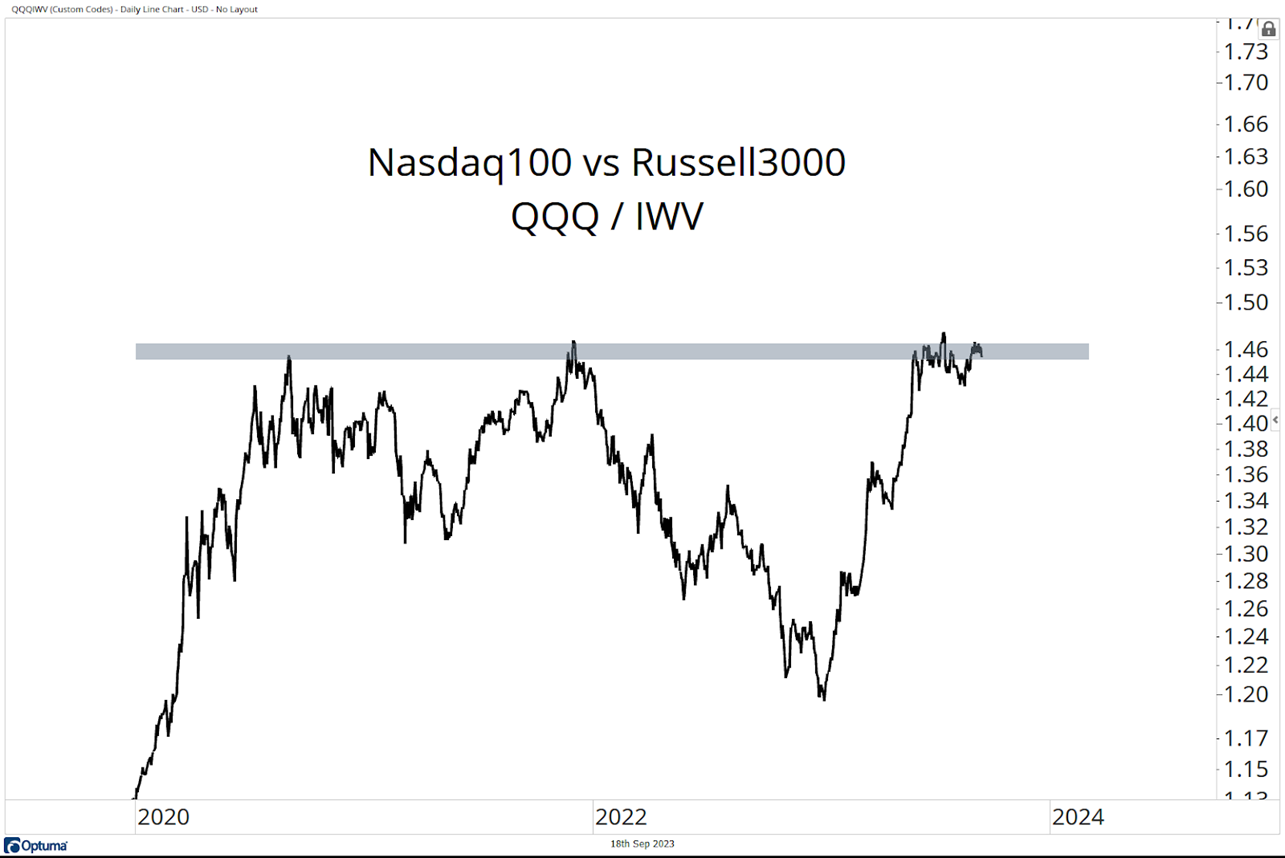
These former highs represent a logical level for corrective action in the coming weeks and months. If that’s the case, and QQQ/IWV gets rejected in this zone, we don’t want to remain overweight growth through the remainder of the year.
However, if and when we finally get a decisive breakout above this resistance level, we’re looking for tech stocks to kick off their next leg up on relative terms.
4. Risk Remains On
As US equities remain trapped in a sideways range, we seek information from risk appetite indicators.
The chart below shows credit spreads (HYG/IEI) in the top pane, high beta stocks versus low volatility (SPHB/SPLV) in the middle pane, and the discretionary sector relative to their consumer staples counterparts (XLY/XLP) in the bottom pane.
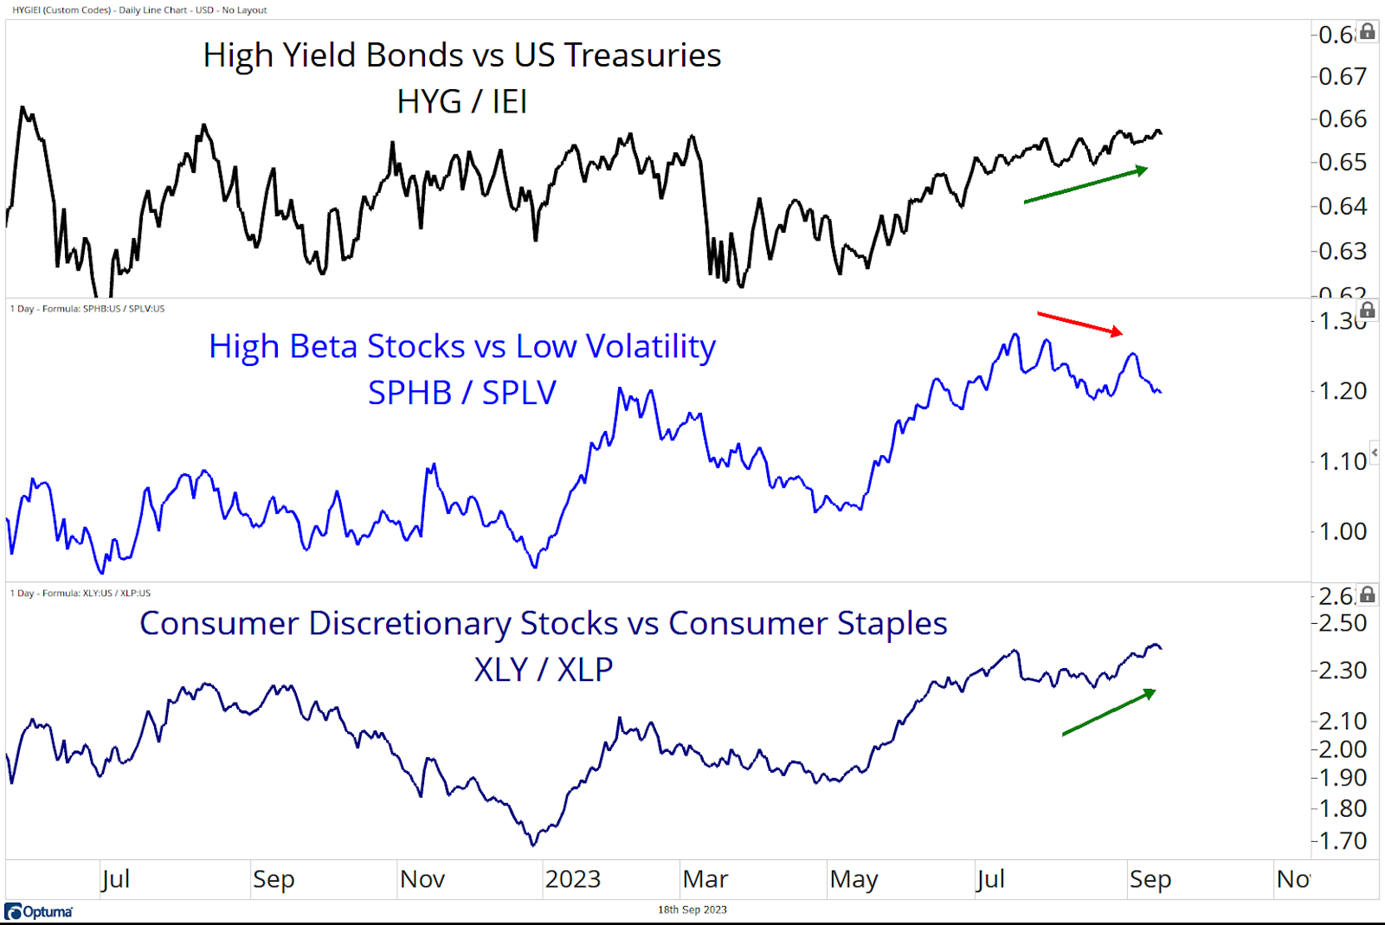
Long story short, when these ratios trend higher, investors are embracing risk and sending a clear signal we’re in a healthy market. The opposite is true when these trends point lower, suggesting an environment conducive to volatility and selling pressure.
As you can see, HYG/IEI and XLY/XLP are trending higher, putting in a series of higher highs and higher lows. However, the SPHB/SPLV ratio is putting in a lower high, contradicting the other two risk appetite ratios.
Bulls want to see these trends rip higher together. This would support risk-seeking behavior and higher prices for equities. Until then, these ratios suggest mixed signals for risk assets.
5. A Bond Market Breakout
When we look at US treasury yields, something is brewing.
As you can see, the US 10-Year Yield and the US 30-Year Yield have been consolidating in a well-defined range since peaking in October last year.
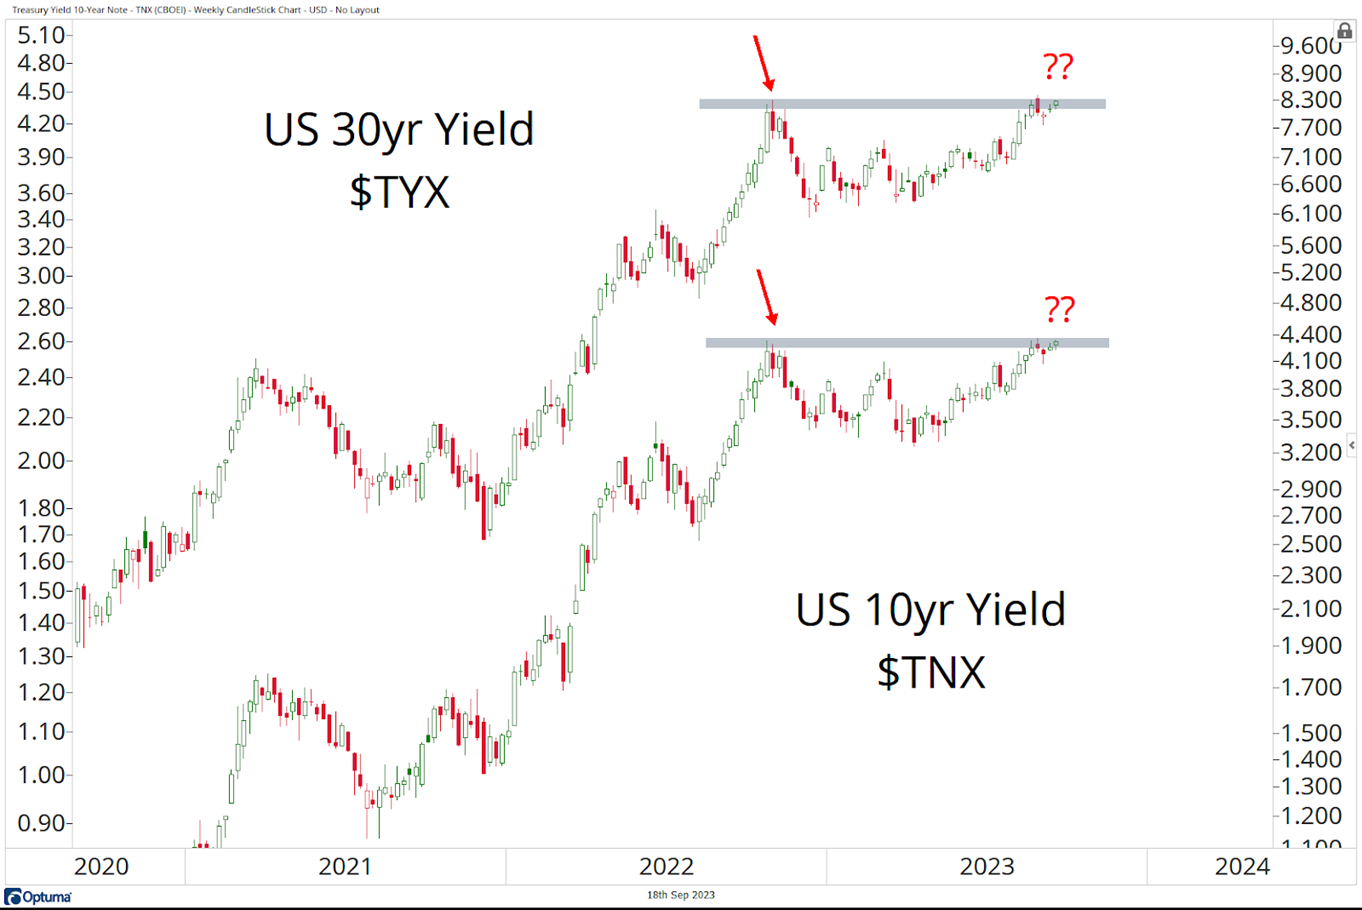
We’re asking ourselves if these rectangle patterns resolve higher in the direction of the underlying trend or if they are rejected at this supply area.
If interest rates are going higher, we will want to bet on further selling pressure for risk assets, especially in growth and tech stocks, and lean on the most value-oriented groups. With potential resolutions this week, it looks like that’s where we’re headed.
As always, Premium Members can rewatch the Conference Call and view the slides here!
We hope you enjoyed our recap of this month’s call. Thanks for reading, and please reach out to us with any questions!
Be the first to comment