
Today, I want to talk about a data modeling concept called junk dimension. From its name, you’d think it’s a technique that’s derogatory and something you’d want to avoid, but it’s actually a useful approach.
In fact, I worked on a question from the Enterprise DNA support forum, and a junk dimension was the perfect solution for it. Once you see and understand it, you’ll find a lot of application for it in your own work. You can watch the full video of this tutorial at the bottom of this blog.
What Are Junk Dimensions?
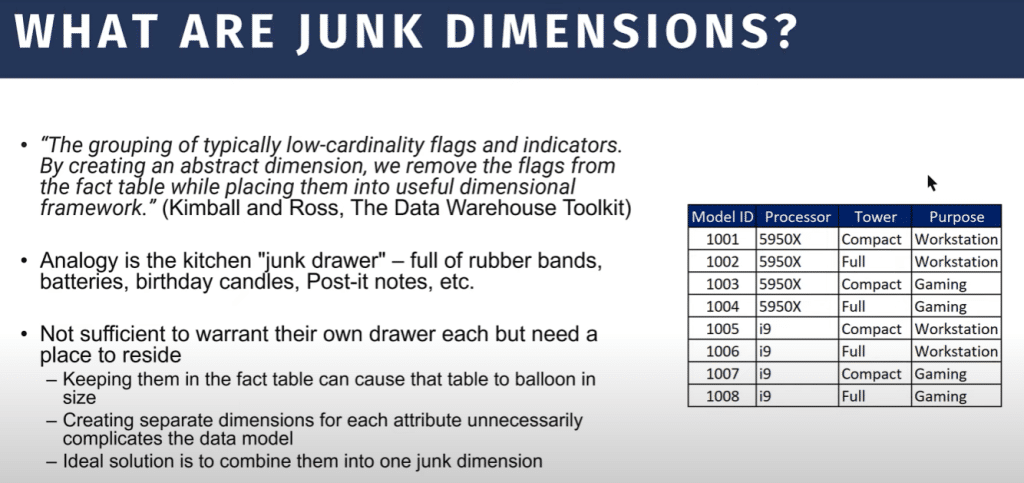
Kimball and Ross’s The Data Warehouse Toolkit, one of the bibles of dimensional modeling, defines it as the grouping of typically low cardinality flags and indicators. Low cardinality means a small number of unique observations within a given field.
In our example, we have a data model for our business of building custom PCs. The data model is with regards to orders and invoices. We also have a number of flags where we can capture the type of processor, type of tower configuration (Compact or Full) and purpose (Gaming or Workstation).

Defining Junk Dimensions Using The Kitchen Junk Drawer Analogy
If you look at each of these fields, there are only two unique observations in each field. This is what Kimball would refer to as a low cardinality flag. He says that by creating an abstract dimension, we remove flags from the fact table while placing them in a useful dimensional framework.
The analogy of the kitchen junk drawer for a junk dimension is a good one. Everybody has a drawer that’s full of rubber bands, staples, batteries, birthday candles, etcetera. It’s not important for any of these things to warrant having their own drawer, but you need to have a place to put them.
Keeping them can cause the fact table to balloon in size. Let’s say we have a fact table with a million records. We built a lot of computers, and for each computer that we build, we have to flag the processor, tower, and purpose. This means that for one million rows of PCs that have been ordered, we also have 3 million flags in the fact table.
Reducing The Size Of The Fact Table
We could move these to a dimension table and link only on the Model ID to remove the 3 million flags from the fact table. To do this, we can make a separate table for each of these flags and it will work. But this process will complicate the data model, where you normally want to avoid single-column tables.
The ideal solution is to use a junk dimension, where you have a bunch of low cardinality flags that are related in a general way. These are all related to attributes of the computers that we’re building, but not in a really direct way that you would normally have for a specific dimension table.
Reviewing The Forum Member’s Problem
Let’s take a look at the specific application which was posted on the forum. The member wanted to create two different fields, one for Stalled and one for Active. If the client made a transaction in the last 45 days, it gets flagged as active; otherwise, it gets flagged as stalled.


The member also wanted another dimension table for Client Type, which is either multi-order or single order. If the account had two or more transactions at any point through history using a single account number, that would be considered a multi-order client. And if they only had one order for a given account number, that would be a single-order client.
So those are the two flags we want to develop. Let’s jump into Power BI and figure out how to do that.
Data Modeling For The Junk Dimension
Let’s take a look at the data model. It’s a really simple data model. We have our extended Dates table and Transactions table.


Our transactions table only has three fields: an account number, invoice date, and sales quantity.


Generally, if we can push the transformation closer to the source, we’ll do that. This is not dynamic within the course of a reporting session, so we don’t need to do it in DAX.
We should be doing it either in power query, or data warehouse/SQL if we have that option. But for now, let’s assume we don’t and that we’re just doing it in power query.
Identifying The Client Type For The Junk Dimension
The first thing we’ll do is figure out the client type, whether it’s a single-order or a multi-order transaction. We’ll use Group By, Count, and Count Rows.


Then add all data and make that an All Rows operation so that we return not the aggregated table, but the initial table with that row count in each row.


Let’s take a look at the result and expand it.


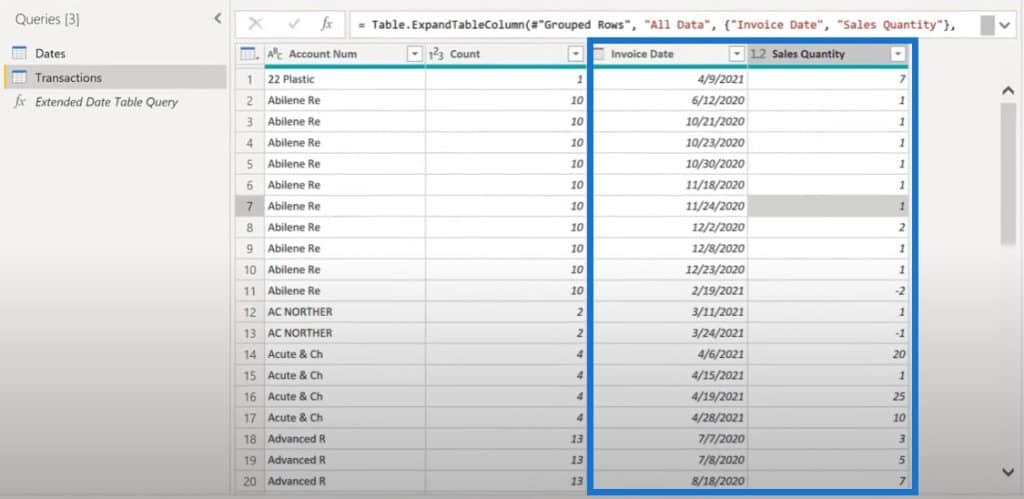

We can add a custom column and name it Client Type and then create an IF statement. The statement is if Count is equal to 1, then it’s a single order; otherwise, it’s multi-order.
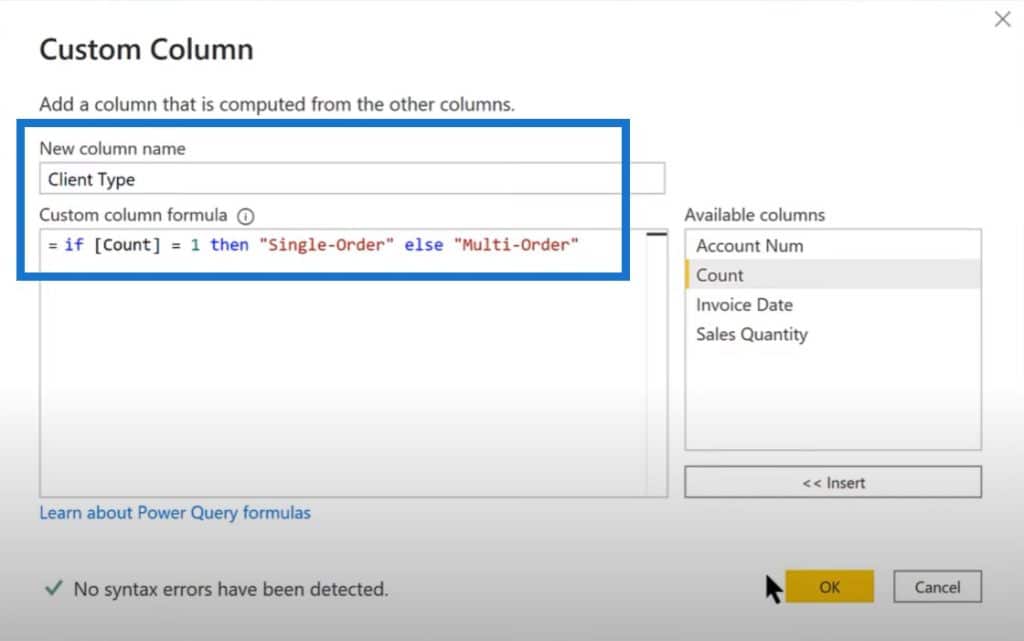

We’ll just change the column to a text type. Now, we have one of our two dimensions set in the fact table.


Let’s get the second dimension table done. For this one, if the most recent order is 45 days or less from today’s date, then the client is viewed as active. If there’s no order within 45 days from today, then the client is inactive.
We’ll add a custom column and name the column Today. Then add DateTime.LocalNow to give us the current date and time, then Date.From to give us only the date portion.
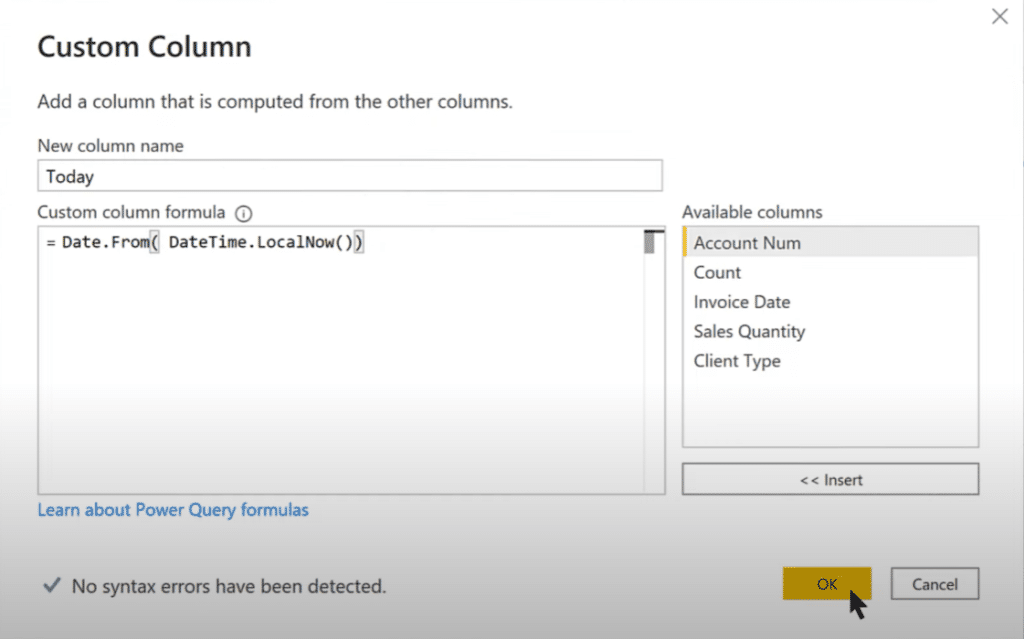

Let’s just change this to a date data type, and then move the column to the front.


There’s a simple way to create a subtraction between the two dates column. Just highlight those two dates, click on Dates on the ribbon, and then click on Subtract Days.
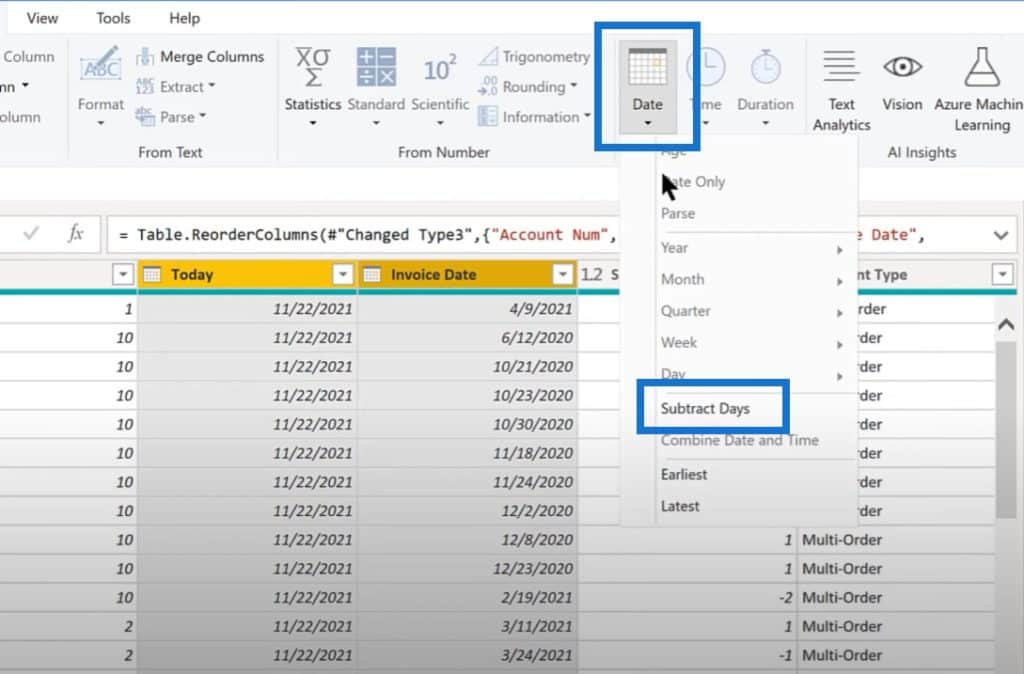

This will give you the difference between those two dates in terms of number of days. Let’s name this new column Days Prior to Today.
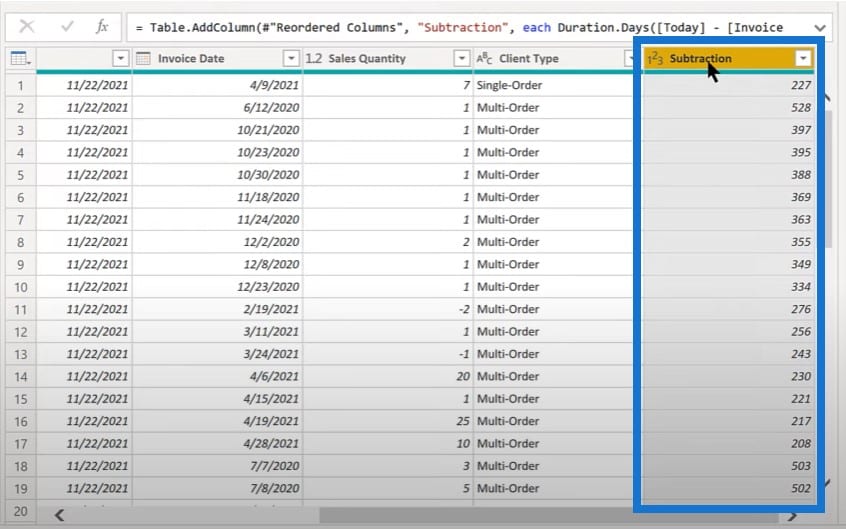

The next step is to find the minimum days prior to today, which means the most recent order for each account number. If that number is less than or equal to 45, it’s active.
Let’s do another Group By, then Advanced, then Account Number.
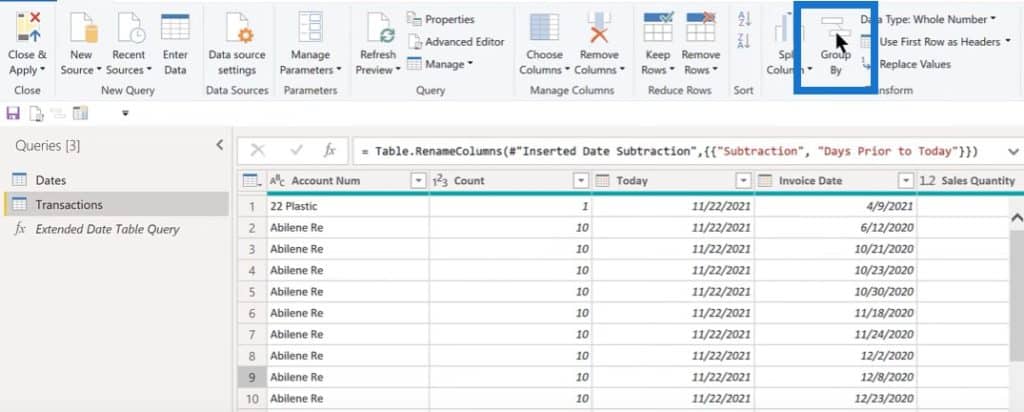

Again, we’ll use All Data for new column name and All Rows for operation.


This time, we’ll add the Minimum Days Between with Minimum as its operation and Days Prior to Today as its column. This will give us the most recent order.


Then we expand the All Data and remove Account Number.


Once we expand this out, we’ll have the Minimum Days Between for the account numbers.


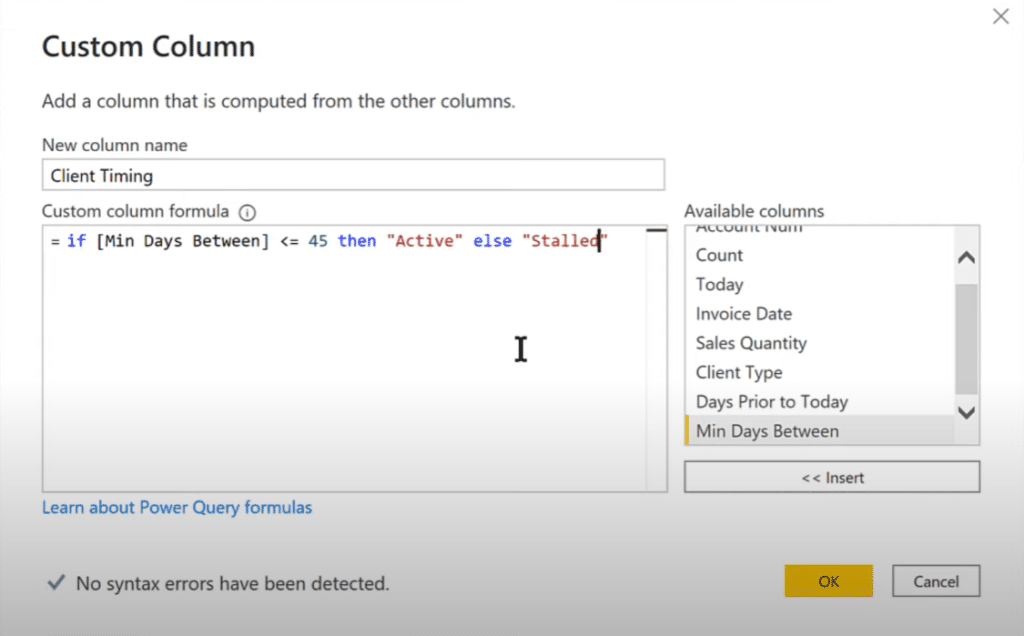
Lastly, we’ll add another custom column, and call it Client Timing. We’ll put in a what-if parameter where if our Min Days Between is less than or equal to 45, then it is Active or else Stalled.


Removing The Unnecessary Columns
Since we now have a lot of supporting columns, let’s click on Choose Columns and take out the ones that we don’t need.
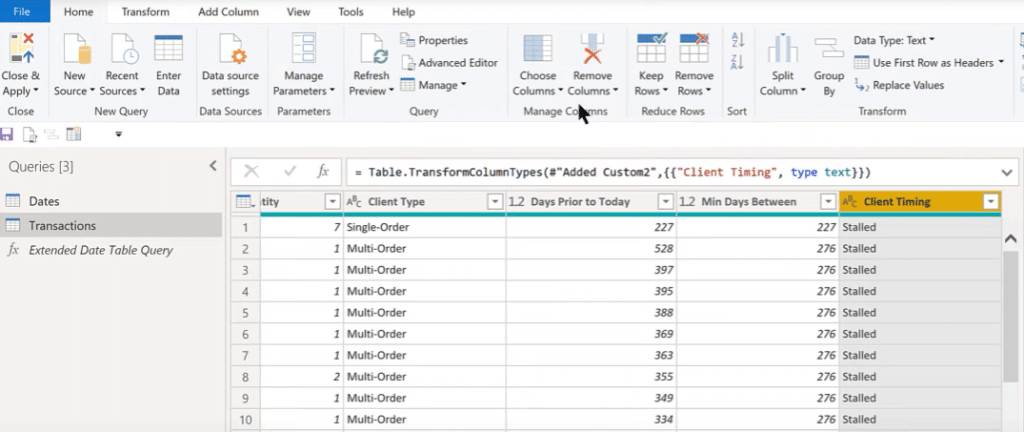

We will be removing the Count, Today, Days Prior to Today, and Min Days Between columns. We now have just the original fact table, plus the Client Type and Client Timing columns.


Instead of keeping these in the fact table, let’s duplicate this table.


We’ll call the duplicate table Account Flags.


Let’s go back to the Transactions table and take out the Client Type and Client Timing fields.


We now have the original fact table and the Account Flags table.
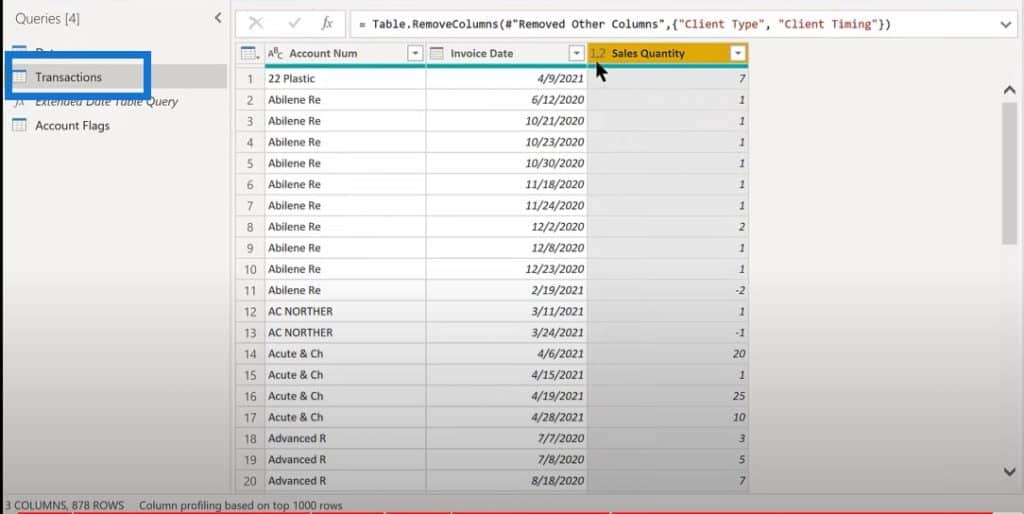

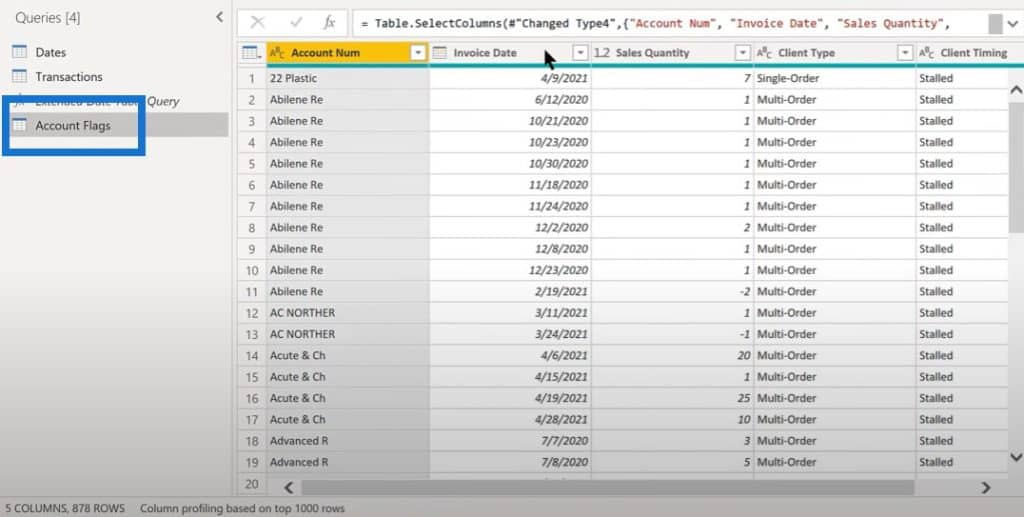

For the Account Flags table, we don’t need the Client Type and Client Timing fields so we take these out. We just highlight all these fields, remove rows, and remove duplicates.
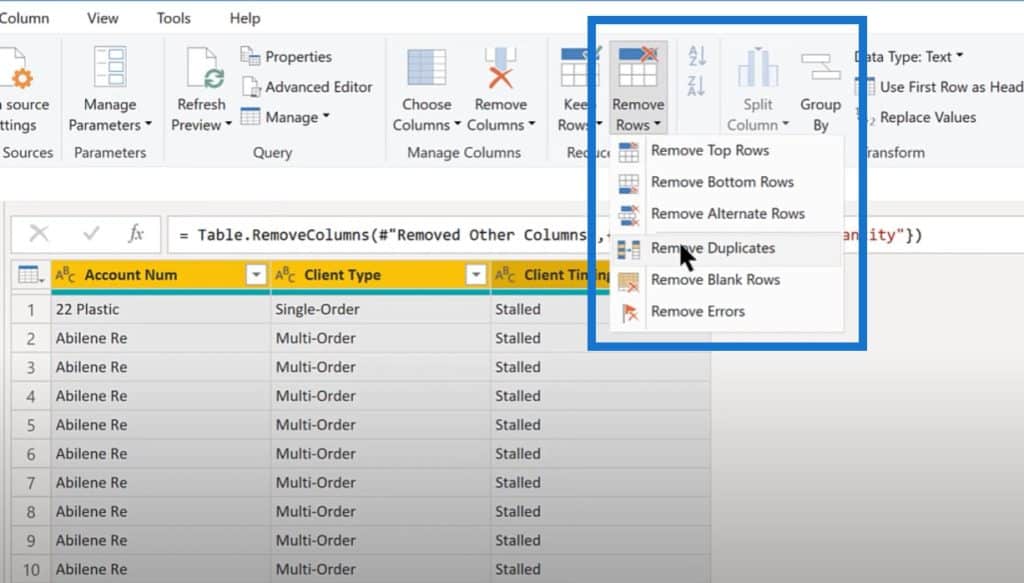

We now have our junk dimension table. All that’s left is to hit Close & Apply. The next step is to connect Account Number from our Account Flags table to the Account Number in our Transactions table.
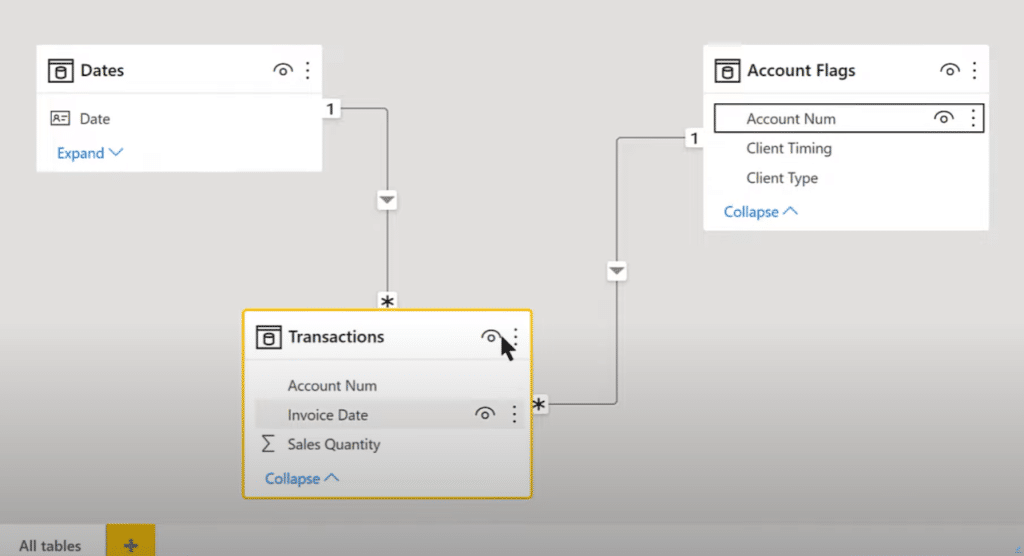

We have a one-to-many relationship between the Transactions table (which is our fact table) and Account Flags table (which is our junk dimension table).
***** Related Links *****
Understanding What Data Modeling Is And Creating The Right Relationships
Building Your Data Model Relationships In Power BI
Data Modelling In Power BI: Tips & Best Practices
Conclusion
Let’s drop the Client Timing and Client Type dimensions into our canvas and turn them into slicers. We can now do exactly what the member wanted to do initially, which is to slice based on these attributes.
If we click on Multi-Order, it’ll leave us only with those that have multiple orders and if we go Single-Order, it’ll leave us with those that have one purchase.


To sum up, this is basically what a junk dimension is, and how you can create it. This is a very useful technique if you have a bunch of assorted, low cardinality flags that you want to incorporate in your data model in an efficient way.
The group by all rows technique is extremely useful for creating these junk dimensions. I hope you found this helpful and as always.
Brian
[youtube https://www.youtube.com/watch?v=cwa1-PIIxTA?rel=0&w=784&h=441]


Be the first to comment